I just tried to reproduce the error, which initially was only possible through starting a debug session, letting it time out, and then restarting another debugging session. When I started a debug session now, it produced an error message straight away. The error message is pasted below.
I’m unsure, why the behavior was different now. Could it be because I had another program flashed onto the ESP32 in the meantime, and it now had to flash the program from scratch?
PlatformIO Unified Debugger -> https://bit.ly/pio-debug
PlatformIO: debug_tool = esp-prog
PlatformIO: Initializing remote target...
Open On-Chip Debugger  v0.11.0-esp32-20220411 (2022-04-11-08:47)
Licensed under GNU GPL v2
For bug reports, read
	http://openocd.org/doc/doxygen/bugs.html
adapter speed: 20000 kHz

WARNING: boards/esp-wroom-32.cfg is deprecated, and may be removed in a future release.
DEPRECATED! use 'adapter speed' not 'adapter_khz'
adapter speed: 5000 kHz

Info : tcl server disabled
Info : telnet server disabled
Info : clock speed 5000 kHz
Info : JTAG tap: esp32.cpu0 tap/device found: 0x120034e5 (mfg: 0x272 (Tensilica), part: 0x2003, ver: 0x1)
Info : JTAG tap: esp32.cpu1 tap/device found: 0x120034e5 (mfg: 0x272 (Tensilica), part: 0x2003, ver: 0x1)
Info : esp32.cpu0: Debug controller was reset.
Info : esp32.cpu0: Core was reset.
Info : esp32.cpu1: Debug controller was reset.
Info : esp32.cpu1: Core was reset.
Info : starting gdb server for esp32.cpu0 on pipe
Info : accepting 'gdb' connection from pipe
Info : esp32.cpu0: Target halted, PC=0x40147732, debug_reason=00000000
Info : Set GDB target to 'esp32.cpu0'
Info : esp32.cpu1: Target halted, PC=0x4008C1D1, debug_reason=00000000
Warn : No symbols for FreeRTOS!
Info : esp32.cpu0: Target halted, PC=0x400803C0, debug_reason=00000001
Error: Failed to get flash maps (1073481520)!
Warn : Failed to get flash mappings (-4)!
Info : esp32.cpu0: Target halted, PC=0x400803C0, debug_reason=00000001
Info : esp32.cpu0: Target halted, PC=0x400803C0, debug_reason=00000001
Info : Auto-detected flash bank 'esp32.cpu0.flash' size 1048321 KB
Info : Using flash bank 'esp32.cpu0.flash' size 1048321 KB
Info : esp32.cpu0: Target halted, PC=0x400803C0, debug_reason=00000001
Error: Failed to get flash maps (1073481520)!
Warn : Failed to get flash mappings (-4)!
Info : esp32.cpu0: Target halted, PC=0x400803C0, debug_reason=00000001
Info : Using flash bank 'esp32.cpu0.irom' size 0 KB
Info : esp32.cpu0: Target halted, PC=0x400803C0, debug_reason=00000001
Error: Failed to get flash maps (1073481520)!
Warn : Failed to get flash mappings (-4)!
Info : esp32.cpu0: Target halted, PC=0x400803C0, debug_reason=00000001
Info : Using flash bank 'esp32.cpu0.drom' size 0 KB
Info : New GDB Connection: 1, Target esp32.cpu0, state: halted
0x40147732 in ?? ()
Error: FreeRTOS maximum used priority is unreasonably big, not proceeding: 64
Info : JTAG tap: esp32.cpu0 tap/device found: 0x120034e5 (mfg: 0x272 (Tensilica), part: 0x2003, ver: 0x1)
Info : JTAG tap: esp32.cpu1 tap/device found: 0x120034e5 (mfg: 0x272 (Tensilica), part: 0x2003, ver: 0x1)
JTAG tap: esp32.cpu0 tap/device found: 0x120034e5 (mfg: 0x272 (Tensilica), part: 0x2003, ver: 0x1)
JTAG tap: esp32.cpu1 tap/device found: 0x120034e5 (mfg: 0x272 (Tensilica), part: 0x2003, ver: 0x1)
Info : esp32.cpu0: Debug controller was reset.
esp32.cpu0: Debug controller was reset.
Info : esp32.cpu0: Core was reset.
esp32.cpu0: Core was reset.
Info : esp32.cpu0: Target halted, PC=0x500000CF, debug_reason=00000000
esp32.cpu0: Target halted, PC=0x500000CF, debug_reason=00000000
Info : esp32.cpu0: Core was reset.
esp32.cpu0: Core was reset.
Info : esp32.cpu0: Target halted, PC=0x40000400, debug_reason=00000000
esp32.cpu0: Target halted, PC=0x40000400, debug_reason=00000000
Info : esp32.cpu1: Debug controller was reset.
esp32.cpu1: Debug controller was reset.
Info : esp32.cpu1: Core was reset.
esp32.cpu1: Core was reset.
Info : esp32.cpu1: Target halted, PC=0x40000400, debug_reason=00000000
esp32.cpu1: Target halted, PC=0x40000400, debug_reason=00000000
Info : esp32.cpu0: Target halted, PC=0x400003C0, debug_reason=00000001
esp32.cpu0: Target halted, PC=0x400003C0, debug_reason=00000001
Error: Failed to get flash maps (9)!
Warn : Failed to get flash mappings (-4)!
Failed to get flash maps (9)!
Failed to get flash mappings (-4)!
Info : esp32.cpu0: Target halted, PC=0x400003C0, debug_reason=00000001
esp32.cpu0: Target halted, PC=0x400003C0, debug_reason=00000001
Info : esp32.cpu0: Target halted, PC=0x400003C0, debug_reason=00000001
esp32.cpu0: Target halted, PC=0x400003C0, debug_reason=00000001
Info : Auto-detected flash bank 'esp32.cpu1.flash' size 0 KB
Info : Using flash bank 'esp32.cpu1.flash' size 0 KB
Auto-detected flash bank 'esp32.cpu1.flash' size 0 KB
Using flash bank 'esp32.cpu1.flash' size 0 KB
** Programming Started **
** Programming Started **
Info : esp32.cpu0: Target halted, PC=0x400003C0, debug_reason=00000001
esp32.cpu0: Target halted, PC=0x400003C0, debug_reason=00000001
Info : esp32.cpu0: Target halted, PC=0x400003C0, debug_reason=00000001
esp32.cpu0: Target halted, PC=0x400003C0, debug_reason=00000001
Error: Failed to erase flash (9)!
Error: failed erasing sectors 1 to 5
Failed to erase flash (9)!
failed erasing sectors 1 to 5
embedded:startup.tcl:1162: Error: ** Programming Failed **
in procedure 'program_esp'
in procedure 'program_error' called at file "/Users/nicolasschwandner/.platformio/packages/tool-openocd-esp32/share/openocd/scripts/target/esp_common.cfg", line 157
at file "embedded:startup.tcl", line 1162
embedded:startup.tcl:1162: Error: ** Programming Failed **
in procedure 'program_esp'
in procedure 'program_error' called at file "/Users/nicolasschwandner/.platformio/packages/tool-openocd-esp32/share/openocd/scripts/target/esp_common.cfg", line 157
at file "embedded:startup.tcl", line 1162
Info : JTAG tap: esp32.cpu0 tap/device found: 0x120034e5 (mfg: 0x272 (Tensilica), part: 0x2003, ver: 0x1)
Info : JTAG tap: esp32.cpu1 tap/device found: 0x120034e5 (mfg: 0x272 (Tensilica), part: 0x2003, ver: 0x1)
JTAG tap: esp32.cpu0 tap/device found: 0x120034e5 (mfg: 0x272 (Tensilica), part: 0x2003, ver: 0x1)
JTAG tap: esp32.cpu1 tap/device found: 0x120034e5 (mfg: 0x272 (Tensilica), part: 0x2003, ver: 0x1)
Info : esp32.cpu0: Debug controller was reset.
esp32.cpu0: Debug controller was reset.
Info : esp32.cpu0: Core was reset.
esp32.cpu0: Core was reset.
Info : esp32.cpu0: Target halted, PC=0x500000CF, debug_reason=00000000
esp32.cpu0: Target halted, PC=0x500000CF, debug_reason=00000000
Info : esp32.cpu0: Core was reset.
esp32.cpu0: Core was reset.
Info : esp32.cpu0: Target halted, PC=0x40000400, debug_reason=00000000
esp32.cpu0: Target halted, PC=0x40000400, debug_reason=00000000
Info : esp32.cpu1: Debug controller was reset.
esp32.cpu1: Debug controller was reset.
Info : esp32.cpu1: Core was reset.
esp32.cpu1: Core was reset.
Info : esp32.cpu1: Target halted, PC=0x40000400, debug_reason=00000000
esp32.cpu1: Target halted, PC=0x40000400, debug_reason=00000000
** Programming Started **
** Programming Started **
Info : esp32.cpu0: Target halted, PC=0x400003C0, debug_reason=00000001
esp32.cpu0: Target halted, PC=0x400003C0, debug_reason=00000001
Info : esp32.cpu0: Target halted, PC=0x400003C0, debug_reason=00000001
esp32.cpu0: Target halted, PC=0x400003C0, debug_reason=00000001
Error: Failed to erase flash (9)!
Error: failed erasing sectors 8 to 8
Failed to erase flash (9)!
failed erasing sectors 8 to 8
embedded:startup.tcl:1162: Error: ** Programming Failed **
in procedure 'program_esp'
in procedure 'program_error' called at file "/Users/nicolasschwandner/.platformio/packages/tool-openocd-esp32/share/openocd/scripts/target/esp_common.cfg", line 157
at file "embedded:startup.tcl", line 1162
embedded:startup.tcl:1162: Error: ** Programming Failed **
in procedure 'program_esp'
in procedure 'program_error' called at file "/Users/nicolasschwandner/.platformio/packages/tool-openocd-esp32/share/openocd/scripts/target/esp_common.cfg", line 157
at file "embedded:startup.tcl", line 1162
Info : JTAG tap: esp32.cpu0 tap/device found: 0x120034e5 (mfg: 0x272 (Tensilica), part: 0x2003, ver: 0x1)
Info : JTAG tap: esp32.cpu1 tap/device found: 0x120034e5 (mfg: 0x272 (Tensilica), part: 0x2003, ver: 0x1)
JTAG tap: esp32.cpu0 tap/device found: 0x120034e5 (mfg: 0x272 (Tensilica), part: 0x2003, ver: 0x1)
JTAG tap: esp32.cpu1 tap/device found: 0x120034e5 (mfg: 0x272 (Tensilica), part: 0x2003, ver: 0x1)
Info : esp32.cpu0: Debug controller was reset.
Info : esp32.cpu0: Core was reset.
esp32.cpu0: Debug controller was reset.
esp32.cpu0: Core was reset.
Info : esp32.cpu0: Target halted, PC=0x500000CF, debug_reason=00000000
esp32.cpu0: Target halted, PC=0x500000CF, debug_reason=00000000
Info : esp32.cpu0: Core was reset.
esp32.cpu0: Core was reset.
Info : esp32.cpu0: Target halted, PC=0x40000400, debug_reason=00000000
esp32.cpu0: Target halted, PC=0x40000400, debug_reason=00000000
Info : esp32.cpu1: Debug controller was reset.
esp32.cpu1: Debug controller was reset.
Info : esp32.cpu1: Core was reset.
esp32.cpu1: Core was reset.
Info : esp32.cpu1: Target halted, PC=0x40000400, debug_reason=00000000
esp32.cpu1: Target halted, PC=0x40000400, debug_reason=00000000
** Programming Started **
** Programming Started **
Info : esp32.cpu0: Target halted, PC=0x400003C0, debug_reason=00000001
esp32.cpu0: Target halted, PC=0x400003C0, debug_reason=00000001
Info : esp32.cpu0: Target halted, PC=0x400003C0, debug_reason=00000001
esp32.cpu0: Target halted, PC=0x400003C0, debug_reason=00000001
Error: Failed to erase flash (9)!
Error: failed erasing sectors 14 to 15
Failed to erase flash (9)!
failed erasing sectors 14 to 15
embedded:startup.tcl:1162: Error: ** Programming Failed **
in procedure 'program_esp'
in procedure 'program_error' called at file "/Users/nicolasschwandner/.platformio/packages/tool-openocd-esp32/share/openocd/scripts/target/esp_common.cfg", line 157
at file "embedded:startup.tcl", line 1162
embedded:startup.tcl:1162: Error: ** Programming Failed **
in procedure 'program_esp'
in procedure 'program_error' called at file "/Users/nicolasschwandner/.platformio/packages/tool-openocd-esp32/share/openocd/scripts/target/esp_common.cfg", line 157
at file "embedded:startup.tcl", line 1162
Info : JTAG tap: esp32.cpu0 tap/device found: 0x120034e5 (mfg: 0x272 (Tensilica), part: 0x2003, ver: 0x1)
Info : JTAG tap: esp32.cpu1 tap/device found: 0x120034e5 (mfg: 0x272 (Tensilica), part: 0x2003, ver: 0x1)
JTAG tap: esp32.cpu0 tap/device found: 0x120034e5 (mfg: 0x272 (Tensilica), part: 0x2003, ver: 0x1)
JTAG tap: esp32.cpu1 tap/device found: 0x120034e5 (mfg: 0x272 (Tensilica), part: 0x2003, ver: 0x1)
Info : esp32.cpu0: Debug controller was reset.
Info : esp32.cpu0: Core was reset.
esp32.cpu0: Debug controller was reset.
esp32.cpu0: Core was reset.
Info : esp32.cpu0: Target halted, PC=0x500000CF, debug_reason=00000000
esp32.cpu0: Target halted, PC=0x500000CF, debug_reason=00000000
Info : esp32.cpu0: Core was reset.
esp32.cpu0: Core was reset.
Info : esp32.cpu0: Target halted, PC=0x40000400, debug_reason=00000000
esp32.cpu0: Target halted, PC=0x40000400, debug_reason=00000000
Info : esp32.cpu1: Debug controller was reset.
esp32.cpu1: Debug controller was reset.
Info : esp32.cpu1: Core was reset.
esp32.cpu1: Core was reset.
Info : esp32.cpu1: Target halted, PC=0x40000400, debug_reason=00000000
esp32.cpu1: Target halted, PC=0x40000400, debug_reason=00000000
** Programming Started **
** Programming Started **
Info : esp32.cpu0: Target halted, PC=0x400003C0, debug_reason=00000001
esp32.cpu0: Target halted, PC=0x400003C0, debug_reason=00000001
Info : esp32.cpu0: Target halted, PC=0x400003C0, debug_reason=00000001
esp32.cpu0: Target halted, PC=0x400003C0, debug_reason=00000001
Error: Failed to erase flash (9)!
Error: failed erasing sectors 16 to 67
Failed to erase flash (9)!
failed erasing sectors 16 to 67
embedded:startup.tcl:1162: Error: ** Programming Failed **
in procedure 'program_esp'
in procedure 'program_error' called at file "/Users/nicolasschwandner/.platformio/packages/tool-openocd-esp32/share/openocd/scripts/target/esp_common.cfg", line 157
at file "embedded:startup.tcl", line 1162
embedded:startup.tcl:1162: Error: ** Programming Failed **
in procedure 'program_esp'
in procedure 'program_error' called at file "/Users/nicolasschwandner/.platformio/packages/tool-openocd-esp32/share/openocd/scripts/target/esp_common.cfg", line 157
at file "embedded:startup.tcl", line 1162
Info : JTAG tap: esp32.cpu0 tap/device found: 0x120034e5 (mfg: 0x272 (Tensilica), part: 0x2003, ver: 0x1)
Info : JTAG tap: esp32.cpu1 tap/device found: 0x120034e5 (mfg: 0x272 (Tensilica), part: 0x2003, ver: 0x1)
JTAG tap: esp32.cpu0 tap/device found: 0x120034e5 (mfg: 0x272 (Tensilica), part: 0x2003, ver: 0x1)
JTAG tap: esp32.cpu1 tap/device found: 0x120034e5 (mfg: 0x272 (Tensilica), part: 0x2003, ver: 0x1)
Info : esp32.cpu0: Debug controller was reset.
esp32.cpu0: Debug controller was reset.
Info : esp32.cpu0: Core was reset.
esp32.cpu0: Core was reset.
Info : esp32.cpu0: Target halted, PC=0x500000CF, debug_reason=00000000
esp32.cpu0: Target halted, PC=0x500000CF, debug_reason=00000000
Info : esp32.cpu0: Core was reset.
esp32.cpu0: Core was reset.
Info : esp32.cpu0: Target halted, PC=0x40000400, debug_reason=00000000
esp32.cpu0: Target halted, PC=0x40000400, debug_reason=00000000
Info : esp32.cpu1: Debug controller was reset.
Info : esp32.cpu1: Core was reset.
esp32.cpu1: Debug controller was reset.
esp32.cpu1: Core was reset.
Info : esp32.cpu1: Target halted, PC=0x40000400, debug_reason=00000000
esp32.cpu1: Target halted, PC=0x40000400, debug_reason=00000000
Temporary breakpoint 1 at 0x400d0d4b: file src/Blink.cpp, line 15.
PlatformIO: Initialization completed
PlatformIO: Resume the execution to `debug_init_break = tbreak setup`
PlatformIO: More configuration options -> https://bit.ly/pio-debug
Warn : address 0x400d0d4b not writable
Error: esp32.cpu0: Failed to write breakpoint instruction (-4)!
Error: esp32.cpu0: Failed to add SW breakpoint!
Error: can't add breakpoint: unknown reason
Warn : address 0x400d0d62 not writable
Error: esp32.cpu0: Failed to write breakpoint instruction (-4)!
Error: esp32.cpu0: Failed to add SW breakpoint!
Error: can't add breakpoint: unknown reason
Warning:
Cannot insert breakpoint 1.
Cannot access memory at address 0x400d0d4b
Cannot insert breakpoint 2.
Cannot access memory at address 0x400d0d62

Command aborted.
When trying to reproduce this error another time, the “setup” breakpoint was actually hit, but when I let the program run to hit the next breakpoint, which is located in the loop() function, it didn’t get there (see picture below). There were error messages in the debug console, which I pasted below the picture. It is very strange that the behavior is changing.
Reading symbols from /Users/nicolasschwandner/Documents/PlatformIO/Projects/220519-110805-arduino-blink/.pio/build/esp32dev/firmware.elf...
PlatformIO Unified Debugger -> https://bit.ly/pio-debug
PlatformIO: debug_tool = esp-prog
PlatformIO: Initializing remote target...
Open On-Chip Debugger  v0.11.0-esp32-20220411 (2022-04-11-08:47)
Licensed under GNU GPL v2
For bug reports, read
	http://openocd.org/doc/doxygen/bugs.html
adapter speed: 20000 kHz

WARNING: boards/esp-wroom-32.cfg is deprecated, and may be removed in a future release.
DEPRECATED! use 'adapter speed' not 'adapter_khz'
adapter speed: 5000 kHz

Info : tcl server disabled
Info : telnet server disabled
Info : clock speed 5000 kHz
Info : JTAG tap: esp32.cpu0 tap/device found: 0x120034e5 (mfg: 0x272 (Tensilica), part: 0x2003, ver: 0x1)
Info : JTAG tap: esp32.cpu1 tap/device found: 0x120034e5 (mfg: 0x272 (Tensilica), part: 0x2003, ver: 0x1)
Info : esp32.cpu0: Target halted, PC=0x4000921F, debug_reason=00000000
Info : esp32.cpu1: Target halted, PC=0x400076DD, debug_reason=00000000
Info : starting gdb server for esp32.cpu0 on pipe
Info : accepting 'gdb' connection from pipe
Warn : No symbols for FreeRTOS!
Info : esp32.cpu0: Target halted, PC=0x4009260E, debug_reason=00000001
Info : Set GDB target to 'esp32.cpu0'
Info : Flash mapping 0: 0x10020 -> 0x3f400020, 196 KB
Info : Flash mapping 1: 0x50020 -> 0x400d0020, 512 KB
Info : esp32.cpu0: Target halted, PC=0x4009260E, debug_reason=00000001
Info : Auto-detected flash bank 'esp32.cpu0.flash' size 4096 KB
Info : Using flash bank 'esp32.cpu0.flash' size 4096 KB
Info : esp32.cpu0: Target halted, PC=0x4009260E, debug_reason=00000001
Info : Flash mapping 0: 0x10020 -> 0x3f400020, 196 KB
Info : Flash mapping 1: 0x50020 -> 0x400d0020, 512 KB
Info : Using flash bank 'esp32.cpu0.irom' size 516 KB
Info : esp32.cpu0: Target halted, PC=0x4009260E, debug_reason=00000001
Info : Flash mapping 0: 0x10020 -> 0x3f400020, 196 KB
Info : Flash mapping 1: 0x50020 -> 0x400d0020, 512 KB
Info : Using flash bank 'esp32.cpu0.drom' size 200 KB
Info : New GDB Connection: 1, Target esp32.cpu0, state: halted
0x4000921f in ?? ()
Error: FreeRTOS maximum used priority is unreasonably big, not proceeding: 64
Info : JTAG tap: esp32.cpu0 tap/device found: 0x120034e5 (mfg: 0x272 (Tensilica), part: 0x2003, ver: 0x1)
Info : JTAG tap: esp32.cpu1 tap/device found: 0x120034e5 (mfg: 0x272 (Tensilica), part: 0x2003, ver: 0x1)
JTAG tap: esp32.cpu0 tap/device found: 0x120034e5 (mfg: 0x272 (Tensilica), part: 0x2003, ver: 0x1)
JTAG tap: esp32.cpu1 tap/device found: 0x120034e5 (mfg: 0x272 (Tensilica), part: 0x2003, ver: 0x1)
Info : esp32.cpu0: Debug controller was reset.
esp32.cpu0: Debug controller was reset.
Info : esp32.cpu0: Core was reset.
esp32.cpu0: Core was reset.
Info : esp32.cpu0: Target halted, PC=0x500000CF, debug_reason=00000000
esp32.cpu0: Target halted, PC=0x500000CF, debug_reason=00000000
Info : esp32.cpu0: Core was reset.
esp32.cpu0: Core was reset.
Info : esp32.cpu0: Target halted, PC=0x40000400, debug_reason=00000000
esp32.cpu0: Target halted, PC=0x40000400, debug_reason=00000000
Info : esp32.cpu1: Debug controller was reset.
esp32.cpu1: Debug controller was reset.
Info : esp32.cpu1: Core was reset.
esp32.cpu1: Core was reset.
Info : esp32.cpu1: Target halted, PC=0x40000400, debug_reason=00000000
esp32.cpu1: Target halted, PC=0x40000400, debug_reason=00000000
Info : esp32.cpu0: Target halted, PC=0x4009260E, debug_reason=00000001
esp32.cpu0: Target halted, PC=0x4009260E, debug_reason=00000001
Info : Flash mapping 0: 0x10020 -> 0x3f400020, 196 KB
Info : Flash mapping 1: 0x50020 -> 0x400d0020, 512 KB
Flash mapping 0: 0x10020 -> 0x3f400020, 196 KB
Flash mapping 1: 0x50020 -> 0x400d0020, 512 KB
Info : esp32.cpu0: Target halted, PC=0x4009260E, debug_reason=00000001
esp32.cpu0: Target halted, PC=0x4009260E, debug_reason=00000001
Info : Auto-detected flash bank 'esp32.cpu1.flash' size 4096 KB
Info : Using flash bank 'esp32.cpu1.flash' size 4096 KB
Auto-detected flash bank 'esp32.cpu1.flash' size 4096 KB
Using flash bank 'esp32.cpu1.flash' size 4096 KB
** Programming Started **
** Programming Started **
Info : esp32.cpu0: Target halted, PC=0x4009260E, debug_reason=00000001
esp32.cpu0: Target halted, PC=0x4009260E, debug_reason=00000001
Info : esp32.cpu0: Target halted, PC=0x4009260E, debug_reason=00000001
esp32.cpu0: Target halted, PC=0x4009260E, debug_reason=00000001
Info : PROF: Data transferred in 109.827 ms @ 182.105 KB/s
PROF: Data transferred in 109.827 ms @ 182.105 KB/s
Info : esp32.cpu0: Target halted, PC=0x4009260E, debug_reason=00000001
esp32.cpu0: Target halted, PC=0x4009260E, debug_reason=00000001
** Programming Finished **
** Programming Finished **
** Verify Started **
** Verify Started **
Info : esp32.cpu0: Target halted, PC=0x4009260E, debug_reason=00000001
esp32.cpu0: Target halted, PC=0x4009260E, debug_reason=00000001
** Verified OK **
** Verified OK **
Info : JTAG tap: esp32.cpu0 tap/device found: 0x120034e5 (mfg: 0x272 (Tensilica), part: 0x2003, ver: 0x1)
Info : JTAG tap: esp32.cpu1 tap/device found: 0x120034e5 (mfg: 0x272 (Tensilica), part: 0x2003, ver: 0x1)
JTAG tap: esp32.cpu0 tap/device found: 0x120034e5 (mfg: 0x272 (Tensilica), part: 0x2003, ver: 0x1)
JTAG tap: esp32.cpu1 tap/device found: 0x120034e5 (mfg: 0x272 (Tensilica), part: 0x2003, ver: 0x1)
Info : esp32.cpu0: Debug controller was reset.
Info : esp32.cpu0: Core was reset.
esp32.cpu0: Debug controller was reset.
esp32.cpu0: Core was reset.
Info : esp32.cpu0: Target halted, PC=0x500000CF, debug_reason=00000000
esp32.cpu0: Target halted, PC=0x500000CF, debug_reason=00000000
Info : esp32.cpu0: Core was reset.
esp32.cpu0: Core was reset.
Info : esp32.cpu0: Target halted, PC=0x40000400, debug_reason=00000000
esp32.cpu0: Target halted, PC=0x40000400, debug_reason=00000000
Info : esp32.cpu1: Debug controller was reset.
esp32.cpu1: Debug controller was reset.
Info : esp32.cpu1: Core was reset.
esp32.cpu1: Core was reset.
Info : esp32.cpu1: Target halted, PC=0x40000400, debug_reason=00000000
esp32.cpu1: Target halted, PC=0x40000400, debug_reason=00000000
** Programming Started **
** Programming Started **
Info : esp32.cpu0: Target halted, PC=0x4009260E, debug_reason=00000001
esp32.cpu0: Target halted, PC=0x4009260E, debug_reason=00000001
Info : esp32.cpu0: Target halted, PC=0x4009260E, debug_reason=00000001
esp32.cpu0: Target halted, PC=0x4009260E, debug_reason=00000001
Info : PROF: Data transferred in 31.007 ms @ 129.003 KB/s
PROF: Data transferred in 31.007 ms @ 129.003 KB/s
Info : esp32.cpu0: Target halted, PC=0x4009260E, debug_reason=00000001
esp32.cpu0: Target halted, PC=0x4009260E, debug_reason=00000001
** Programming Finished **
** Programming Finished **
** Verify Started **
** Verify Started **
Info : esp32.cpu0: Target halted, PC=0x4009260E, debug_reason=00000001
esp32.cpu0: Target halted, PC=0x4009260E, debug_reason=00000001
** Verified OK **
** Verified OK **
Info : JTAG tap: esp32.cpu0 tap/device found: 0x120034e5 (mfg: 0x272 (Tensilica), part: 0x2003, ver: 0x1)
Info : JTAG tap: esp32.cpu1 tap/device found: 0x120034e5 (mfg: 0x272 (Tensilica), part: 0x2003, ver: 0x1)
JTAG tap: esp32.cpu0 tap/device found: 0x120034e5 (mfg: 0x272 (Tensilica), part: 0x2003, ver: 0x1)
JTAG tap: esp32.cpu1 tap/device found: 0x120034e5 (mfg: 0x272 (Tensilica), part: 0x2003, ver: 0x1)
Info : esp32.cpu0: Debug controller was reset.
Info : esp32.cpu0: Core was reset.
esp32.cpu0: Debug controller was reset.
esp32.cpu0: Core was reset.
Info : esp32.cpu0: Target halted, PC=0x500000CF, debug_reason=00000000
esp32.cpu0: Target halted, PC=0x500000CF, debug_reason=00000000
Info : esp32.cpu0: Core was reset.
esp32.cpu0: Core was reset.
Info : esp32.cpu0: Target halted, PC=0x40000400, debug_reason=00000000
esp32.cpu0: Target halted, PC=0x40000400, debug_reason=00000000
Info : esp32.cpu1: Debug controller was reset.
esp32.cpu1: Debug controller was reset.
Info : esp32.cpu1: Core was reset.
esp32.cpu1: Core was reset.
Info : esp32.cpu1: Target halted, PC=0x40000400, debug_reason=00000000
esp32.cpu1: Target halted, PC=0x40000400, debug_reason=00000000
** Programming Started **
** Programming Started **
Info : esp32.cpu0: Target halted, PC=0x4009260E, debug_reason=00000001
esp32.cpu0: Target halted, PC=0x4009260E, debug_reason=00000001
Info : esp32.cpu0: Target halted, PC=0x4009260E, debug_reason=00000001
esp32.cpu0: Target halted, PC=0x4009260E, debug_reason=00000001
Info : PROF: Data transferred in 48.477 ms @ 165.027 KB/s
PROF: Data transferred in 48.477 ms @ 165.027 KB/s
Info : esp32.cpu0: Target halted, PC=0x4009260E, debug_reason=00000001
esp32.cpu0: Target halted, PC=0x4009260E, debug_reason=00000001
** Programming Finished **
** Programming Finished **
** Verify Started **
** Verify Started **
Info : esp32.cpu0: Target halted, PC=0x4009260E, debug_reason=00000001
esp32.cpu0: Target halted, PC=0x4009260E, debug_reason=00000001
** Verified OK **
** Verified OK **
Info : JTAG tap: esp32.cpu0 tap/device found: 0x120034e5 (mfg: 0x272 (Tensilica), part: 0x2003, ver: 0x1)
Info : JTAG tap: esp32.cpu1 tap/device found: 0x120034e5 (mfg: 0x272 (Tensilica), part: 0x2003, ver: 0x1)
JTAG tap: esp32.cpu0 tap/device found: 0x120034e5 (mfg: 0x272 (Tensilica), part: 0x2003, ver: 0x1)
JTAG tap: esp32.cpu1 tap/device found: 0x120034e5 (mfg: 0x272 (Tensilica), part: 0x2003, ver: 0x1)
Info : esp32.cpu0: Debug controller was reset.
esp32.cpu0: Debug controller was reset.
Info : esp32.cpu0: Core was reset.
esp32.cpu0: Core was reset.
Info : esp32.cpu0: Target halted, PC=0x500000CF, debug_reason=00000000
esp32.cpu0: Target halted, PC=0x500000CF, debug_reason=00000000
Info : esp32.cpu0: Core was reset.
esp32.cpu0: Core was reset.
Info : esp32.cpu0: Target halted, PC=0x40000400, debug_reason=00000000
esp32.cpu0: Target halted, PC=0x40000400, debug_reason=00000000
Info : esp32.cpu1: Debug controller was reset.
esp32.cpu1: Debug controller was reset.
Info : esp32.cpu1: Core was reset.
esp32.cpu1: Core was reset.
Info : esp32.cpu1: Target halted, PC=0x40000400, debug_reason=00000000
esp32.cpu1: Target halted, PC=0x40000400, debug_reason=00000000
** Programming Started **
** Programming Started **
Info : esp32.cpu0: Target halted, PC=0x4009260E, debug_reason=00000001
esp32.cpu0: Target halted, PC=0x4009260E, debug_reason=00000001
Info : esp32.cpu0: Target halted, PC=0x4009260E, debug_reason=00000001
esp32.cpu0: Target halted, PC=0x4009260E, debug_reason=00000001
Info : PROF: Data transferred in 1116.02 ms @ 186.377 KB/s
PROF: Data transferred in 1116.02 ms @ 186.377 KB/s
Info : esp32.cpu0: Target halted, PC=0x4009260E, debug_reason=00000001
esp32.cpu0: Target halted, PC=0x4009260E, debug_reason=00000001
** Programming Finished **
** Programming Finished **
** Verify Started **
** Verify Started **
Info : esp32.cpu0: Target halted, PC=0x4009260E, debug_reason=00000001
esp32.cpu0: Target halted, PC=0x4009260E, debug_reason=00000001
** Verified OK **
** Verified OK **
Info : JTAG tap: esp32.cpu0 tap/device found: 0x120034e5 (mfg: 0x272 (Tensilica), part: 0x2003, ver: 0x1)
Info : JTAG tap: esp32.cpu1 tap/device found: 0x120034e5 (mfg: 0x272 (Tensilica), part: 0x2003, ver: 0x1)
JTAG tap: esp32.cpu0 tap/device found: 0x120034e5 (mfg: 0x272 (Tensilica), part: 0x2003, ver: 0x1)
JTAG tap: esp32.cpu1 tap/device found: 0x120034e5 (mfg: 0x272 (Tensilica), part: 0x2003, ver: 0x1)
Info : esp32.cpu0: Debug controller was reset.
Info : esp32.cpu0: Core was reset.
esp32.cpu0: Debug controller was reset.
esp32.cpu0: Core was reset.
Info : esp32.cpu0: Target halted, PC=0x500000CF, debug_reason=00000000
esp32.cpu0: Target halted, PC=0x500000CF, debug_reason=00000000
Info : esp32.cpu0: Core was reset.
esp32.cpu0: Core was reset.
Info : esp32.cpu0: Target halted, PC=0x40000400, debug_reason=00000000
esp32.cpu0: Target halted, PC=0x40000400, debug_reason=00000000
Info : esp32.cpu1: Debug controller was reset.
esp32.cpu1: Debug controller was reset.
Info : esp32.cpu1: Core was reset.
esp32.cpu1: Core was reset.
Info : esp32.cpu1: Target halted, PC=0x40000400, debug_reason=00000000
esp32.cpu1: Target halted, PC=0x40000400, debug_reason=00000000
Temporary breakpoint 1 at 0x400d0d4b: file src/Blink.cpp, line 15.
PlatformIO: Initialization completed
PlatformIO: Resume the execution to `debug_init_break = tbreak setup`
PlatformIO: More configuration options -> https://bit.ly/pio-debug
Note: automatically using hardware breakpoints for read-only addresses.
Info : esp32.cpu0: Target halted, PC=0x400DB732, debug_reason=00000000
esp32.cpu0: Target halted, PC=0x400DB732, debug_reason=00000000
Info : Set GDB target to 'esp32.cpu0'
Set GDB target to 'esp32.cpu0'
Info : esp32.cpu1: Target halted, PC=0x400D0D4B, debug_reason=00000001
esp32.cpu1: Target halted, PC=0x400D0D4B, debug_reason=00000001
[New Thread 1073468984]
[New Thread 1073469344]
[New Thread 1073458404]
[New Thread 1073463388]
[New Thread 1073456804]
[New Thread 1073468624]
[Switching to Thread 1073449076]

Thread 1 "loopTask" hit Temporary breakpoint 1, setup () at src/Blink.cpp:15
15	  pinMode(LED_BUILTIN, OUTPUT);
Error: esp32.cpu1: DSR (FFFFFFFF) indicates target still busy!
Error: esp32.cpu1: DSR (FFFFFFFF) indicates DIR instruction generated an exception!
Error: esp32.cpu1: DSR (FFFFFFFF) indicates DIR instruction generated an overrun!
esp32.cpu1: DSR (FFFFFFFF) indicates target still busy!
esp32.cpu1: DSR (FFFFFFFF) indicates DIR instruction generated an exception!
esp32.cpu1: DSR (FFFFFFFF) indicates DIR instruction generated an overrun!
Error: esp32.cpu0: DSR (FFFFFFFF) indicates target still busy!
Error: esp32.cpu0: DSR (FFFFFFFF) indicates DIR instruction generated an exception!
Error: esp32.cpu0: DSR (FFFFFFFF) indicates DIR instruction generated an overrun!
esp32.cpu0: DSR (FFFFFFFF) indicates target still busy!
esp32.cpu0: DSR (FFFFFFFF) indicates DIR instruction generated an exception!
esp32.cpu0: DSR (FFFFFFFF) indicates DIR instruction generated an overrun!
Info : esp32.cpu0: Debug controller was reset.
esp32.cpu0: Debug controller was reset.
Info : esp32.cpu0: Core was reset.
esp32.cpu0: Core was reset.
Info : esp32.cpu1: Debug controller was reset.
esp32.cpu1: Debug controller was reset.
Info : esp32.cpu1: Core was reset.
esp32.cpu1: Core was reset.
Regarding the power supply: I, unfortunately, don’t have much hardware available. Is there a sleek way of doing this? The ESP32 board doesn’t have a USB jack and I also don’t have an external power supply available here. Otherwise, any recommendations for a handy and cheap power supply?
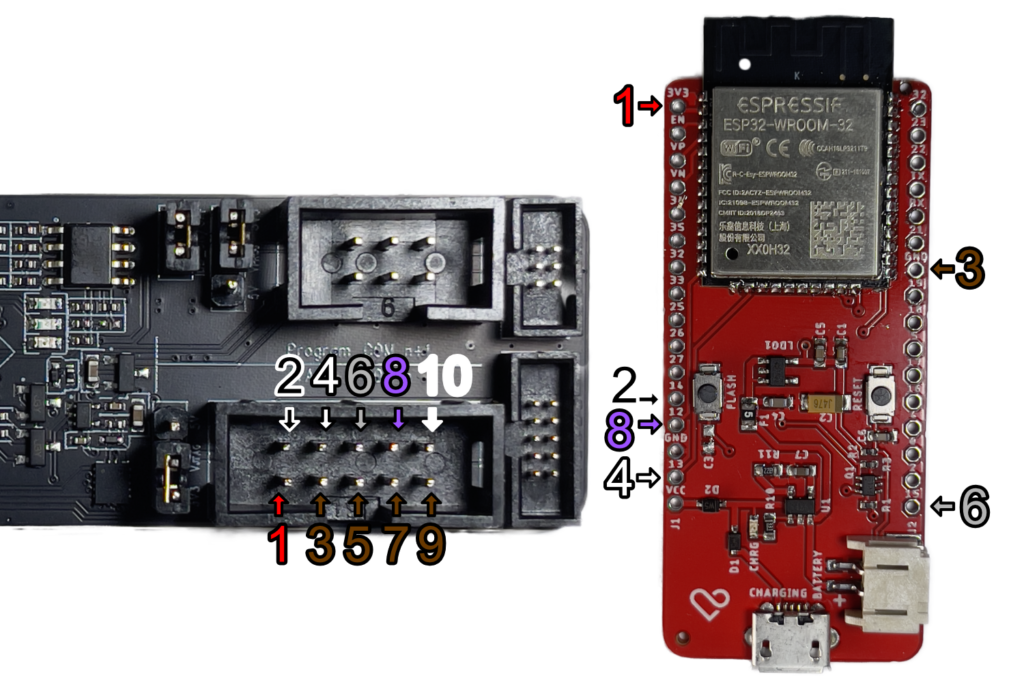
Regarding the wiring: There’s an ESP32-WROOM-32E on the board I’m using. From what I can tell from the Espressif website, this should be the normal one (ESP32 - link).