Flashing and debugging with STM32

Hi there o/

I´m having issues with flashing and debugging my Nucleo-STM32F446RE with the PIO extention on VSCode. Its connected via USB and the current stlink driver is installed.

First of all, the platformio.ini:

[env:nucleo_f446re]
platform = ststm32
board = nucleo_f446re
upload_protocol = stlink
debug_tool = stlink
framework = cmsis

so, building shows no errors. not even a yellow warning. At first, flashing was successfull, but after i tried different settings in the ini-file (because debugging failed), its now failing to. It shows following error:

Configuring upload protocol...
AVAILABLE: blackmagic, cmsis-dap, jlink, mbed, stlink
CURRENT: upload_protocol = stlink
Uploading .pio\build\nucleo_f446re\firmware.elf
xPack OpenOCD x86_64 Open On-Chip Debugger 0.11.0+dev (2021-10-16-21:19)
Licensed under GNU GPL v2
For bug reports, read
        http://openocd.org/doc/doxygen/bugs.html
debug_level: 1

srst_only separate srst_nogate srst_open_drain connect_deassert_srst

Error: init mode failed (unable to connect to the target)
in procedure 'program'
** OpenOCD init failed **
shutdown command invoked

Debugg error:

PlatformIO Unified Debugger -> https://bit.ly/pio-debug
PlatformIO: debug_tool = stlink
PlatformIO: Initializing remote target...
xPack OpenOCD x86_64 Open On-Chip Debugger 0.11.0+dev (2021-10-16-21:19)
Licensed under GNU GPL v2
For bug reports, read
http://openocd.org/doc/doxygen/bugs.html
Info : The selected transport took over low-level target control. The results might differ compared to plain JTAG/SWD
srst_only separate srst_nogate srst_open_drain connect_deassert_srst
Info : tcl server disabled
Info : telnet server disabled
Info : clock speed 2000 kHz
Info : STLINK V2J38M27 (API v2) VID:PID 0483:374B
Info : Target voltage: 3.247151
Error: init mode failed (unable to connect to the target)

soo… Does anyone know how to fix this? ._.
Just as a test: Hold down the reset button on the board, start the Upload task, when the OpenOCD output starts to appear and appears to hang, release reset again. Timing might be tricky. Does it work?

Thx for you help! Upload succeeded with following message:

Uploading .pio\build\nucleo_f446re\firmware.elf
xPack OpenOCD x86_64 Open On-Chip Debugger 0.11.0+dev (2021-10-16-21:19)
Licensed under GNU GPL v2
For bug reports, read
        http://openocd.org/doc/doxygen/bugs.html
debug_level: 1

srst_only separate srst_nogate srst_open_drain connect_deassert_srst

i released the reset button at this point

target halted due to debug-request, current mode: Thread 
xPSR: 0x01000000 pc: 0x080002b0 msp: 0x20020000
** Programming Started **
** Programming Finished **
** Verify Started **
** Verified OK **
** Resetting Target **
Error: jtag status contains invalid mode value - communication failure
Polling target stm32f4x.cpu failed, trying to reexamine
Examination failed, GDB will be halted. Polling again in 100ms
shutdown command invoked

so flashing seems to work now, but i still cant start the debugger.

Does your firmware use the SWD pins PA13/14? I’ve sen bad firmwares causing this result.

Can you switch to the most simplistic Arduino firmware and config

[env:nucleo_f446re]
platform = ststm32
board = nucleo_f446re
framework = arduino
#include <Arduino.h>
void setup() {}
void loop(){}

After uploading it once with the reset button trick, does it fail to upload again afterwards?

how can i check what pins my firmware is using?

i´m not used to arduino. would basic register based code run in this framework too?

Doesn’t matter, you just need to copy the platofrmio.ini and src/main.cpp code above (while removing or renaming your original src/main.c).

This is just a test whether your firmware affects the upload.

So i followed your instructions and both flashing and debugging succeed!! :partying_face: :partying_face:
seems like its the firmware… so how can we fix it?

Here the console output while entering debugging, if its of any help:

PlatformIO Unified Debugger -> https://bit.ly/pio-debug
PlatformIO: debug_tool = stlink
PlatformIO: Initializing remote target...
xPack OpenOCD x86_64 Open On-Chip Debugger 0.11.0+dev (2021-10-16-21:19)
Licensed under GNU GPL v2
For bug reports, read
http://openocd.org/doc/doxygen/bugs.html
Info : The selected transport took over low-level target control. The results might differ compared to plain JTAG/SWD
srst_only separate srst_nogate srst_open_drain connect_deassert_srst
Info : tcl server disabled
Info : telnet server disabled
Info : clock speed 2000 kHz
Info : STLINK V2J38M27 (API v2) VID:PID 0483:374B
Info : Target voltage: 3.236079
Info : stm32f4x.cpu: Cortex-M4 r0p1 processor detected
Info : stm32f4x.cpu: target has 6 breakpoints, 4 watchpoints
Info : starting gdb server for stm32f4x.cpu on pipe
Info : accepting 'gdb' connection from pipe
target halted due to debug-request, current mode: Thread
xPSR: 0x61000000 pc: 0x080019ea msp: 0x2001fff8
Info : device id = 0x10006421
Info : flash size = 512 kbytes
Info : flash size = 512 bytes
0x080019ea in __static_initialization_and_destruction_0 (__initialize_p=536871452, __priority=3) at c:\users\patrick\.platformio\packages\toolchain-gccarmnoneeabi\arm-none-eabi\include\c++\9.2.1\bits/std_function.h:403
403 function(nullptr_t) noexcept
2 Info : Unable to match requested speed 2000 kHz, using 1800 kHz
target halted due to debug-request, current mode: Thread
xPSR: 0x01000000 pc: 0x08001be0 msp: 0x20020000
2 Info : Unable to match requested speed 8000 kHz, using 4000 kHz
Warn : keep_alive() was not invoked in the 1000 ms timelimit. GDB alive packet not sent! (1016 ms). Workaround: increase "set remotetimeout" in GDB
Loading section .isr_vector, size 0x1c4 lma 0x8000000
Loading section .text, size 0x26a4 lma 0x80001c4
Loading section .rodata, size 0x374 lma 0x8002868
Loading section .ARM, size 0x8 lma 0x8002bdc
Loading section .init_array, size 0x10 lma 0x8002be4
Loading section .fini_array, size 0x8 lma 0x8002bf4
Loading section .data, size 0x70 lma 0x8002bfc
2 Info : Unable to match requested speed 2000 kHz, using 1800 kHz
target halted due to debug-request, current mode: Thread
xPSR: 0x01000000 pc: 0x08001f88 msp: 0x20020000
Start address 0x8001f88, load size 11372
Transfer rate: 6 KB/sec, 1624 bytes/write.
2 Info : Unable to match requested speed 2000 kHz, using 1800 kHz
2 Unable to match requested speed 2000 kHz, using 1800 kHz
target halted due to debug-request, current mode: Thread
xPSR: 0x01000000 pc: 0x08001f88 msp: 0x20020000
target halted due to debug-request, current mode: Thread
xPSR: 0x01000000 pc: 0x08001f88 msp: 0x20020000
Temporary breakpoint 1 at 0x8001f74: file ~\.platformio\packages\framework-arduinoststm32\cores\arduino\main.cpp, line 50.
PlatformIO: Initialization completed
PlatformIO: Resume the execution to `debug_init_break = tbreak main`
PlatformIO: More configuration options -> https://bit.ly/pio-debug
Note: automatically using hardware breakpoints for read-only addresses.

Hard to say when I can’t see the firmware code. I suggest though you first test if the simplest possible CMSIS example can also be repeadedly flashed and debugged.

It´s so f***ing jinxed…

So I tried the cmsis-blink yesterday. I had to use the example for disco-f407vg and make some changes to make it work - but it worked. I was able to build, flash and debug the example. Since the example worked, I started copying file for file of my project into the example project. I´ve gone sure that there no conflicting headers and so on… But debugging failed… it just cant connect… It´s so frustrating

So today I tried the stm32cube-hal-blink, it works without changes and after including my code I´m also able to debug. But peripheral registers wont chance. No led blinks. nothing… just nothing…
I know my code works, because since this is so frustrating i just copied everything into the stm IDE and it´s working there

With only textual descriptions of the problem and no code it’s hard to know what’s going on.

Hi @maxgerhardt

I’d like to carry on with this thread and troubleshoot with your guidance. I’m experiencing the same problem related to debugging.

I tested the framework = arduino and it worked fine with the a simple blink example with setup() and loop().

It’s when utilizing the stm32cube framework (with nucleo_f401re) that seems to be struggling, as experienced by @xpatp. When it comes to pins. I’m testing the basics, so the SWD pins (PA13/14) are not utilized in the firmware example. I’m utilizing the stm32cube-hal-blink example that comes along with the ST STM32 Platform in PlatformIO.

I get the following in the debug console:

Reading symbols from C:\Users\XXXXX\Downloads\230523-101336-stm32cube-hal-blink\.pio\build\nucleo_f072rb\firmware.elf...
done.
PlatformIO Unified Debugger -> https://bit.ly/pio-debug
PlatformIO: debug_tool = stlink
PlatformIO: Initializing remote target...
xPack OpenOCD x86_64 Open On-Chip Debugger 0.11.0+dev (2021-10-16-21:19)
Licensed under GNU GPL v2
For bug reports, read
	http://openocd.org/doc/doxygen/bugs.html
Info : The selected transport took over low-level target control. The results might differ compared to plain JTAG/SWD
srst_only separate srst_nogate srst_open_drain connect_deassert_srst

Info : tcl server disabled
Info : telnet server disabled
Info : clock speed 1000 kHz
Error: open failed
2

.pioinit:13: Error in sourced command file:

I tried out aswell the CMSIS-blink example. I added the following in the platform.ini-file:

[env:nucleo_f401re]
platform = ststm32
framework = stm32cube
board = nucleo_f401re
build_flags = -DSTM32F4

Same problem with debugging, however, it won’t upload.

From Upload:

...
Uploading .pio\build\nucleo_f401re\firmware.elf
xPack OpenOCD x86_64 Open On-Chip Debugger 0.11.0+dev (2021-10-16-21:19)
Licensed under GNU GPL v2
For bug reports, read
        http://openocd.org/doc/doxygen/bugs.html
debug_level: 1

srst_only separate srst_nogate srst_open_drain connect_deassert_srst

Error: libusb_open() failed with LIBUSB_ERROR_ACCESS
Error: open failed
in procedure 'program'
** OpenOCD init failed **
shutdown command invoked

*** [upload] Error 1

From debugging (DEBUG CONSOLE):

...
xPack OpenOCD x86_64 Open On-Chip Debugger 0.11.0+dev (2021-10-16-21:19)
Licensed under GNU GPL v2
For bug reports, read
	http://openocd.org/doc/doxygen/bugs.html
Info : The selected transport took over low-level target control. The results might differ compared to plain JTAG/SWD
srst_only separate srst_nogate srst_open_drain connect_deassert_srst

Info : tcl server disabled
Info : telnet server disabled
Info : clock speed 2000 kHz
Error: libusb_open() failed with LIBUSB_ERROR_ACCESS
Error: open failed
2

.pioinit:13: Error in sourced command file:

I’m up for testing further, to solve this conflict!

Are you sure you have the latest ST-Link drivers installed? Download + install STM32CubeProg - STM32CubeProgrammer software for all STM32 - STMicroelectronics and check if you can connect to the chip via SWD at all.

You’re right. It seems the ST-Link Driver that was for some wierd reason missing (I previously installed it from here https://www.st.com/en/development-tools/stsw-link009.html ).

The debug does not seem to work after this. I’ll start checking the forum to see if there are any relevant threads for this new error.

(I did a restart of the computer after installation, and also deleted the .pio and .vscode folders aswell before reopening the project)

Debug console:

xPack OpenOCD x86_64 Open On-Chip Debugger 0.11.0+dev (2021-10-16-21:19)
Licensed under GNU GPL v2
For bug reports, read
	http://openocd.org/doc/doxygen/bugs.html
Info : The selected transport took over low-level target control. The results might differ compared to plain JTAG/SWD
srst_only separate srst_nogate srst_open_drain connect_deassert_srst

Info : tcl server disabled
Info : telnet server disabled
Info : clock speed 1000 kHz
Info : STLINK V2J42M27 (API v2) VID:PID 0483:374B
Info : Target voltage: 3.258831
Warn : UNEXPECTED idcode: 0x2ba01477
Error: expected 1 of 1: 0x0bb11477
2

.pioinit:13: Error in sourced command file:

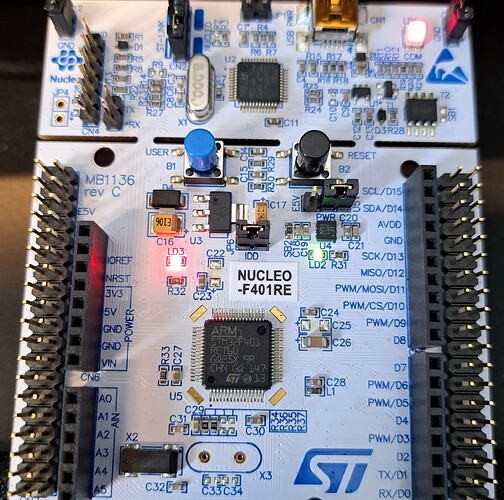
Can you take a picture of the main MCU on your nucleo board? This indicates you’re on a completely different one than the SMT32F401RE that you specified.

@maxgerhardt You suspect it to be a chinese clone?

No this looks alright.

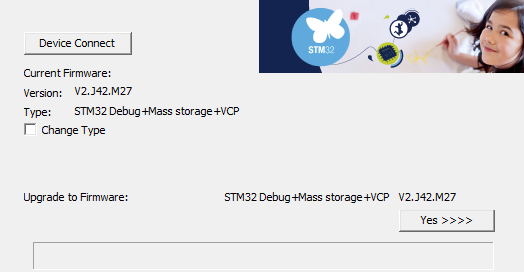
Can you use https://www.st.com/en/development-tools/stsw-link007.html to upgrade the STLink firmware version to the latest one?

I had the newest firmware already uploaded earlier today. I tried to change type aswell (with or without Mass storage).

st-link-firmware-updater

Still no difference. The exact same “incorrect” idcode.

I assume this is becoming more of an out-of-scope problem for platformio

I have tried in addition the “fixes” such as:

debug_init_cmds =
  set CPUTAPID 0x2ba01477
  target extended-remote $DEBUG_PORT
  $INIT_BREAK
  monitor reset halt
  $LOAD_CMDS
  monitor init
  monitor reset halt

and

upload_flags = -c set CPUTAPID 0x2ba01477

From debugging-of-stm32f103-clone-bluepill-board-wrong-idcode. However, neither of them seemed to work.

@maxgerhardt , Correction. It seems like it works now. I’m not sure how it be that it works now. But i’ll carry on testing it to see if it is persistent now. Thank you for taking your time to help me with the “out-of-the-scope”-problem :slight_smile:

I assume we can consider the original post solved :wink: