Failed to launch GDB: .pioinit:11

Hello everyone.

I am trying to get up the ESP-Prog in VS code, Pio. However, when I click “Start debugging” in Pio, I get the Error:

Failed to launch GDB: .pioinit:11: Error in sourced command file:
Remote communication error.  Target disconnected.: No error. (from interpreter-exec console "source .pioinit")

The debug console reads:

Processing esp32dev (platform: espressif32; board: esp32dev; framework: arduino)
--------------------------------------------------------------------------------
Verbose mode can be enabled via `-v, --verbose` option
CONFIGURATION: https://docs.platformio.org/page/boards/espressif32/esp32dev.html
PLATFORM: Espressif 32 (3.0.0) > Espressif ESP32 Dev Module
HARDWARE: ESP32 240MHz, 320KB RAM, 4MB Flash
Preformatted text DEBUG: Current (esp-prog) External (esp-prog, iot-bus-jtag, jlink, minimodule, olimex-arm-usb-ocd, olimex-arm-usb-ocd-h, olimex-arm-usb-tiny-h, olimex-jtag-tiny, tumpa)
PACKAGES:
 - framework-arduinoespressif32 3.10004.210126 (1.0.4)
 - tool-esptoolpy 1.30000.201119 (3.0.0)
 - toolchain-xtensa32 2.50200.80 (5.2.0)
LDF: Library Dependency Finder -> http://bit.ly/configure-pio-ldf
LDF Modes: Finder ~ chain, Compatibility ~ soft
Found 26 compatible libraries
Scanning dependencies...
No dependencies
Building in debug mode
Retrieving maximum program size .pio\build\esp32dev\firmware.elf
Checking size .pio\build\esp32dev\firmware.elf
Advanced Memory Usage is available via "PlatformIO Home > Project Inspect"
RAM:   [          ]   4.7% (used 15436 bytes from 327680 bytes)
Flash: [==        ]  16.5% (used 216673 bytes from 1310720 bytes)
========================= [SUCCESS] Took 1.72 seconds =========================
Reading symbols from c:\Users\gmiva\Documents\PlatformIO\Projects\esp32_debug_test\.pio\build\esp32dev\firmware.elf...
done.
PlatformIO Unified Debugger -> http://bit.ly/pio-debug
PlatformIO: debug_tool = esp-prog
PlatformIO: Initializing remote target...
Open On-Chip Debugger  v0.10.0-esp32-20201202 (2020-12-02-17:38)
Licensed under GNU GPL v2
For bug reports, read
	http://openocd.org/doc/doxygen/bugs.html
adapter speed: 20000 kHz

WARNING: boards/esp-wroom-32.cfg is deprecated, and may be removed in a future release.
Info : FreeRTOS creation
adapter speed: 5000 kHz

Info : tcl server disabled
Info : telnet server disabled
Error: libusb_open() failed with LIBUSB_ERROR_NOT_SUPPORTED
Info : clock speed 5000 kHz
Error: JTAG scan chain interrogation failed: all ones
Error: Check JTAG interface, timings, target power, etc.
Error: Trying to use configured scan chain anyway...
Error: esp32.cpu0: IR capture error; saw 0x1f not 0x01
Warn : Bypassing JTAG setup events due to errors
Info : accepting 'gdb' connection from pipe
Warn : No symbols for FreeRTOS!
Error: Target not examined yet
Error executing event gdb-attach on target esp32.cpu0:

Error: Target not halted
Error: auto_probe failed
Error: Connect failed. Consider setting up a gdb-attach event for the target to prepare target for GDB connect, or use 'gdb_memory_map disable'.
Error: attempted 'gdb' connection rejected
Error: error during select: Unknown error
.pioinit:11: Error in sourced command file:
Remote communication error.  Target disconnected.: No error.

My platromio.ini file:

[env:esp32dev]
platform = espressif32
board = esp32dev
framework = arduino
monitor_speed = 115200
upload_speed = 921000
debug_tool = esp-prog
debug_init_break = tbreak setup

Main.cpp:

#include <Arduino.h>

void setup() 
{
  Serial.begin(9600);
}

void loop() 
{
  Serial.print("here");
  delay(1000);                 
}

I have the most recent Zadig windows drivers installed. Running PlatformIO Core, version 5.1.1a1 (Dev-build), Visual Studio Code 1.53.0.

Any advice on getting this working would be very much appreciated.
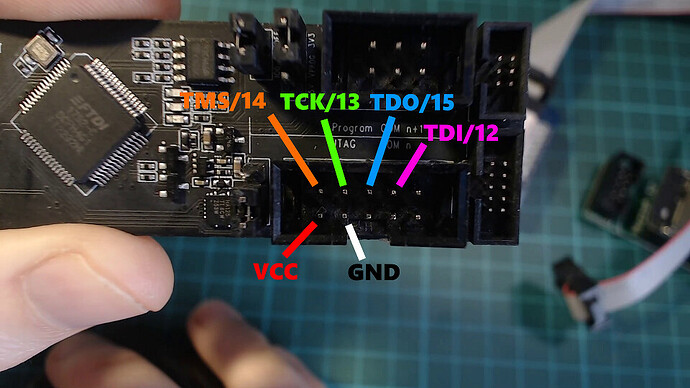
This right there.

How did you connect the ESP-Prog to the target ESP32 board?

Is the target board powered?

Does reducing the JTAG frequency help, by e.g. adding debug_speed = 500 in the platformio.ini?

Thanks for your quick response!

The ESP32 is connected to the 5v rail on the ESP-Prog with a common ground.

I added debug_speed = 500 to the platformio.ini and got the same error. Debub console error:

Processing esp32dev (platform: espressif32; board: esp32dev; framework: arduino)
--------------------------------------------------------------------------------
Verbose mode can be enabled via `-v, --verbose` option
CONFIGURATION: https://docs.platformio.org/page/boards/espressif32/esp32dev.html
PLATFORM: Espressif 32 (3.0.0) > Espressif ESP32 Dev Module
HARDWARE: ESP32 240MHz, 320KB RAM, 4MB Flash
DEBUG: Current (esp-prog) External (esp-prog, iot-bus-jtag, jlink, minimodule, olimex-arm-usb-ocd, olimex-arm-usb-ocd-h, olimex-arm-usb-tiny-h, olimex-jtag-tiny, tumpa)
PACKAGES:
 - framework-arduinoespressif32 3.10004.210126 (1.0.4)
 - tool-esptoolpy 1.30000.201119 (3.0.0)
 - toolchain-xtensa32 2.50200.80 (5.2.0)
LDF: Library Dependency Finder -> http://bit.ly/configure-pio-ldf
LDF Modes: Finder ~ chain, Compatibility ~ soft
Found 26 compatible libraries
Scanning dependencies...
No dependencies
Building in debug mode
Retrieving maximum program size .pio\build\esp32dev\firmware.elf
Checking size .pio\build\esp32dev\firmware.elf
Advanced Memory Usage is available via "PlatformIO Home > Project Inspect"
RAM:   [          ]   4.7% (used 15436 bytes from 327680 bytes)
Flash: [==        ]  16.5% (used 216673 bytes from 1310720 bytes)
========================= [SUCCESS] Took 1.70 seconds =========================
Reading symbols from c:\Users\gmiva\Documents\PlatformIO\Projects\esp32_debug_test\.pio\build\esp32dev\firmware.elf...
done.
PlatformIO Unified Debugger -> http://bit.ly/pio-debug
PlatformIO: debug_tool = esp-prog
PlatformIO: Initializing remote target...
Open On-Chip Debugger  v0.10.0-esp32-20201202 (2020-12-02-17:38)
Licensed under GNU GPL v2
For bug reports, read
	http://openocd.org/doc/doxygen/bugs.html
adapter speed: 20000 kHz

WARNING: boards/esp-wroom-32.cfg is deprecated, and may be removed in a future release.
Info : FreeRTOS creation
adapter speed: 500 kHz

Info : tcl server disabled
Info : telnet server disabled
Error: libusb_open() failed with LIBUSB_ERROR_NOT_SUPPORTED
Info : clock speed 500 kHz
Info : JTAG tap: esp32.cpu0 tap/device found: 0x120034e5 (mfg: 0x272 (Tensilica), part: 0x2003, ver: 0x1)
Info : JTAG tap: esp32.cpu1 tap/device found: 0x120034e5 (mfg: 0x272 (Tensilica), part: 0x2003, ver: 0x1)
Error: esp32.cpu0: IR capture error; saw 0x1f not 0x01
Warn : Bypassing JTAG setup events due to errors
Info : accepting 'gdb' connection from pipe
Warn : No symbols for FreeRTOS!
Error: Target not examined yet
Error executing event gdb-attach on target esp32.cpu0:

Error: Target not halted
Error: auto_probe failed
Error: Connect failed. Consider setting up a gdb-attach event for the target to prepare target for GDB connect, or use 'gdb_memory_map disable'.
Error: attempted 'gdb' connection rejected
Error: error during select: Unknown error
.pioinit:11: Error in sourced command file:
Remote communication error.  Target disconnected.: No error.

ini file after change:

[env:esp32dev]
platform = espressif32
board = esp32dev
framework = arduino
monitor_speed = 115200
upload_speed = 921000
debug_tool = esp-prog
debug_init_break = tbreak setup
debug_speed = 500

The ESP32 is connected to the ESP-Prog using the pinout in the photo below.

1 Like

Well but you see it did improve. The first output with a clock of 5MHz was

but now

It at least starts to see that a device is there in the JTAG scan chain.

I’m suspecting bad or long cables. Try replacing the speed again with debug_speed = 200 to go even lower.

That didn’t seem to do the trick.

Debug output after setting debug_speed = 200

Processing esp32dev (platform: espressif32; board: esp32dev; framework: arduino)
--------------------------------------------------------------------------------
Verbose mode can be enabled via `-v, --verbose` option
CONFIGURATION: https://docs.platformio.org/page/boards/espressif32/esp32dev.html
PLATFORM: Espressif 32 (3.0.0) > Espressif ESP32 Dev Module
HARDWARE: ESP32 240MHz, 320KB RAM, 4MB Flash
DEBUG: Current (esp-prog) External (esp-prog, iot-bus-jtag, jlink, minimodule, olimex-arm-usb-ocd, olimex-arm-usb-ocd-h, olimex-arm-usb-tiny-h, olimex-jtag-tiny, tumpa)
PACKAGES:
 - framework-arduinoespressif32 3.10004.210126 (1.0.4)
 - tool-esptoolpy 1.30000.201119 (3.0.0)
 - toolchain-xtensa32 2.50200.80 (5.2.0)
LDF: Library Dependency Finder -> http://bit.ly/configure-pio-ldf
LDF Modes: Finder ~ chain, Compatibility ~ soft
Found 26 compatible libraries
Scanning dependencies...
No dependencies
Building in debug mode
Retrieving maximum program size .pio\build\esp32dev\firmware.elf
Checking size .pio\build\esp32dev\firmware.elf
Advanced Memory Usage is available via "PlatformIO Home > Project Inspect"
RAM:   [          ]   4.7% (used 15436 bytes from 327680 bytes)
Flash: [==        ]  16.5% (used 216673 bytes from 1310720 bytes)
========================= [SUCCESS] Took 1.70 seconds =========================
Reading symbols from c:\Users\gmiva\Documents\PlatformIO\Projects\esp32_debug_test\.pio\build\esp32dev\firmware.elf...
done.
PlatformIO Unified Debugger -> http://bit.ly/pio-debug
PlatformIO: debug_tool = esp-prog
PlatformIO: Initializing remote target...
Open On-Chip Debugger  v0.10.0-esp32-20201202 (2020-12-02-17:38)
Licensed under GNU GPL v2
For bug reports, read
	http://openocd.org/doc/doxygen/bugs.html
adapter speed: 20000 kHz

WARNING: boards/esp-wroom-32.cfg is deprecated, and may be removed in a future release.
Info : FreeRTOS creation
adapter speed: 200 kHz

Info : tcl server disabled
Info : telnet server disabled
Error: libusb_open() failed with LIBUSB_ERROR_NOT_SUPPORTED
Info : clock speed 200 kHz
Error: JTAG scan chain interrogation failed: all ones
Error: Check JTAG interface, timings, target power, etc.
Error: Trying to use configured scan chain anyway...
Error: esp32.cpu0: IR capture error; saw 0x1f not 0x01
Warn : Bypassing JTAG setup events due to errors
Info : accepting 'gdb' connection from pipe
Warn : No symbols for FreeRTOS!
Error: Target not examined yet
Error executing event gdb-attach on target esp32.cpu0:

Error: Target not halted
Error: auto_probe failed
Error: Connect failed. Consider setting up a gdb-attach event for the target to prepare target for GDB connect, or use 'gdb_memory_map disable'.
Error: attempted 'gdb' connection rejected
Error: error during select: Unknown error
.pioinit:11: Error in sourced command file:
Remote communication error.  Target disconnected.: No error.

Are you able to normally flash the ESP32 via the serial bootloader?

Please make sure that only a e.g. Blinky sketch is running on it. If the firmware accesses JTAG pins, debugging won’t work.

To which target ESP32 board are you connecting it exactly?

Can you try powering the ESP32 separately via USB (and still the common ground)? The WiFi / startup might need a huge current on startup and the ESP-Prog might not be able to power the board.

1 Like

Bloody hell… I spent most of the day fighting an uphill battle and losing. It turns out nothing was wrong with Pio or the JTAG adaptor; I had a defective ESP32. I had another ESP, pugged it with the default setting, and it worked as expected.

My only complaint is the debugger is a bit slow. It can take several seconds to go between lines, but aside from that, it works great!

If you know if it’s possible to make the debugger feel a bit more responsive, please let me know. Other than that, everything works!

Did you put back the debug_speed to something like 5000? Depending on the cable even 20000 might be possible.

Hi,

Same here
Iam using esp-prog connected to ESP32-Dev board
I areldy checked the pin between on everything is correct.
I try to power with 2 USB => same pb !
I just wanna try debug function with ARDUINO blink example
but any code give same result: I can dl and it works great but debug fail

My platformio.ini : PlatformIO Project Configuration File
;
; Build options: build flags, source filter, extra scripting
; Upload options: custom port, speed and extra flags
; Library options: dependencies, extra library storages
;
; Please visit documentation for the other options and examples
; Redirecting...

[env:esp32dev]
platform = espressif32
;platform = GitHub - platformio/platform-espressif32: Espressif 32: development platform for PlatformIO
framework = arduino
board = esp32dev

monitor_speed = 115200
build_flags =
; https://docs.espressif.com/projects/esp-idf/en/latest/get-started/get-started-wrover-kit.html#rgb-led
-D LED_BUILTIN=2
; change microcontroller
board_build.mcu = esp32
board_build.f_cpu = 240000000L
; set frequency to 40MHz
board_build.f_flash = 40000000L
board_build.flash_mode = dio

;******************************************************
;ABOUT uploading ************************
;
****************************************
upload_protocol = esptool ;default protocol is esptool
upload_speed = 115200
upload_port = COM11

;******************************************************
;ABOUT DEBUGGER *************************
;
****************************************

build_type = debug

;upload_protocol = esp-prog
debug_tool = esp-prog
; fixed speed in kHz
debug_speed = 500

Debug console :
Processing esp32dev (platform: espressif32; framework: arduino; board: esp32dev)


Verbose mode can be enabled via -v, --verbose option

CONFIGURATION: Redirecting...

PLATFORM: Espressif 32 (3.0.0) > Espressif ESP32 Dev Module

HARDWARE: ESP32 240MHz, 320KB RAM, 4MB Flash

DEBUG: Current (esp-prog) External (esp-prog, iot-bus-jtag, jlink, minimodule, olimex-arm-usb-ocd, olimex-arm-usb-ocd-h, olimex-arm-usb-tiny-h, olimex-jtag-tiny, tumpa)

PACKAGES:

  • framework-arduinoespressif32 3.10004.210126 (1.0.4)

  • tool-esptoolpy 1.30000.201119 (3.0.0)

  • tool-openocd-esp32 2.1000.20201202 (10.0)

  • toolchain-xtensa32 2.50200.80 (5.2.0)

LDF: Library Dependency Finder → Library Dependency Finder (LDF) — PlatformIO latest documentation

LDF Modes: Finder ~ chain, Compatibility ~ soft

Found 26 compatible libraries

Scanning dependencies…

No dependencies

Building in debug mode

Retrieving maximum program size .pio\build\esp32dev\firmware.elf
Error: esp32.cpu1: DSR (FFFFFFFF) indicates target still busy!

Error: esp32.cpu1: DSR (FFFFFFFF) indicates DIR instruction generated an exception!

Error: esp32.cpu1: DSR (FFFFFFFF) indicates DIR instruction generated an overrun!

Warn : esp32.cpu1: Failed writing 4 bytes at address 0x3ff5f064

Error: Failed to write ESP32_TIMG0WDT_PROTECT (-4)!

Polling target esp32.cpu1 failed, trying to reexamine

Info : accepting ‘gdb’ connection from pipe

Warn : No symbols for FreeRTOS!

Info : Halt timed out, wake up GDB.

Error: timed out while waiting for target halted / 3 - 2

Error executing event gdb-attach on target esp32.cpu0:

Error: Target not halted

Error: auto_probe failed

Error: Connect failed. Consider setting up a gdb-attach event for the target to prepare target for GDB connect, or use ‘gdb_memory_map disable’.

Error: attempted ‘gdb’ connection rejected

Error: error during select: Unknown error

.pioinit:11: Error in sourced command file:

Remote communication error. Target disconnected.: No error.

Funny thing. I had the same issue. I was able to upload the firmware successfully but debug wouldnt start with similar errors.
I solved the problem by rebooting my PC :thinking: