Esp32 wrover kit debug VSCODE

MAC 10.14.2 with ESP32-WROVER-KIT. I thought i had the issue fixed but it came back. Initially I couldn’t get the debugger working. I messed with a few things, and it started working. But then while debugging, if i set a breakpoint, it would run until the breakpoint and then i could not continue. After reseting the board, I am back to the same issue as not recognizing the debugger. So it seems that it does not appear to be a usb driver issue but more something with openOCD. Also, i was able to use the FTDI to upload by setting the correct port and the upload_protocol to FTDI, but now that fails as well.

Processing esp-wrover-kit (framework: arduino; platform: espressif32; board: esp-wrover-kit)

Verbose mode can be enabled via -v, --verbose option
CONFIGURATION: Redirecting...
PLATFORM: Espressif 32 > Espressif ESP-WROVER-KIT
HARDWARE: ESP32 240MHz 320KB RAM (4MB Flash)
DEBUG: CURRENT(ftdi) ON-BOARD(ftdi) EXTERNAL(esp-prog, iot-bus-jtag, jlink, minimodule, olimex-arm-usb-ocd, olimex-arm-usb-ocd-h, olimex-arm-usb-tiny-h, olimex-jtag-tiny, tumpa)
Library Dependency Finder → Library Dependency Finder (LDF) — PlatformIO latest documentation
LDF MODES: FINDER(chain) COMPATIBILITY(soft)
Collected 68 compatible libraries
Scanning dependencies…
Dependency Graph
|-- <TFT_eSPI> 1.3.9
| |-- 1.0
| | |-- 1.0
| |-- 1.0
| |-- 1.0
|-- <ModbusIP_ESP8266> 1.0.0
| |-- 1.0.0
| |-- 1.0
|-- 1.0
|--
| |-- 1.0
| |-- 1.0
| | |-- 1.0
| |-- 1.0
|-- 1.0
| |-- 1.0
| | |-- 1.0
| |-- 1.0
| |-- 1.0
|-- 0.99.9 #e81e172
| |-- 1.1.0
| | |-- 1.0
| |-- 1.0
| |-- 1.0
| | |-- 1.0
| | |-- 1.0
|-- 1.0.3
| |-- 1.0
|-- 1.0.0
|-- 1.0
| |-- 1.0
|-- 1.0
|-- 1.0
|-- 1.1.0
| |-- 1.0
|-- 1.2.0
| |-- 1.0
|-- 1.0
| |-- 1.0
| |-- 1.0
|-- 1.0
|-- <autoVersioning_master>
|-- 1.0.0
|-- 1.0.0
|-- 1.0
|-- 1.0
| |-- 1.0
|-- 3.0.2
|-- 2.7
Linking .pioenvs/esp-wrover-kit/firmware.elf
Building .pioenvs/esp-wrover-kit/firmware.bin
Retrieving maximum program size .pioenvs/esp-wrover-kit/firmware.elf
Checking size .pioenvs/esp-wrover-kit/firmware.elf
Memory Usage → Redirecting...
DATA: [== ] 16.0% (used 52276 bytes from 327680 bytes)
PROGRAM: [======== ] 75.3% (used 987322 bytes from 1310720 bytes)
========================= [SUCCESS] Took 10.50 seconds =========================

================================== [SUMMARY] ==================================
Environment esp-wrover-kit [SUCCESS]
Environment esp32dev [SKIP]
========================= [SUCCESS] Took 10.50 seconds =========================
undefinedOpen On-Chip Debugger 0.10.0-dev (2018-11-05-04:08)
Licensed under GNU GPL v2
For bug reports, read
OpenOCD: Bug Reporting
none separate
adapter speed: 20000 kHz
esp32 interrupt mask on
Info : ftdi: if you experience problems at higher adapter clocks, try the command “ftdi_tdo_sample_edge falling”
Info : clock speed 20000 kHz
Error: JTAG scan chain interrogation failed: all ones
Error: Check JTAG interface, timings, target power, etc.
Error: Trying to use configured scan chain anyway…
Error: esp32.cpu0: IR capture error; saw 0x1f not 0x01
Warn : Bypassing JTAG setup events due to errors
Reading symbols from /Users/waltermarchewka/Documents/PlatformIO/Projects/HOMESTAT_V1/.pioenvs/esp-wrover-kit/firmware.elf…
done.
PlatformIO Unified Debugger > Redirecting...
PlatformIO: Initializing remote target…
Info : accepting ‘gdb’ connection on tcp/3333
Error: Target not examined yet

Error: Target not halted
Error: auto_probe failed
Error: Connect failed. Consider setting up a gdb-attach event for the target to prepare target for GDB connect, or use ‘gdb_memory_map disable’.
Error: attempted ‘gdb’ connection rejected
.pioinit:10: Error in sourced command file:
Remote connection closed
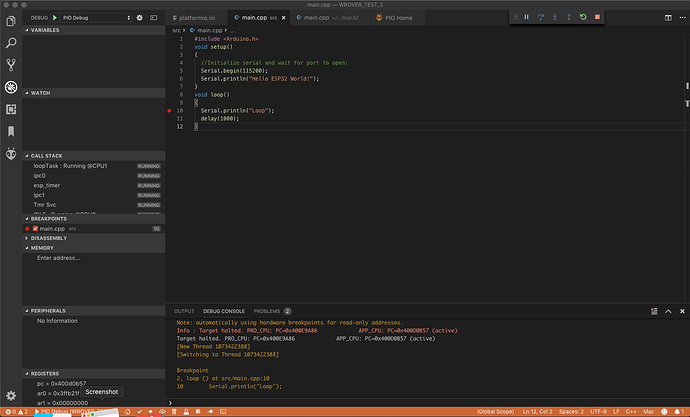
So the debug is starting at least. The issue I am having now is that after the initial Temporary breakpoint, i hit the continue button. The breakpoint i set is hit, but then i cannot continue. Any ideas?

It seems that this thread is similar to what im experiencing. I did try the new openocd from github, but no help. Again, the issue is the the first temp break works, and upon continue, it will stop at my breakpoint but will not continue. If i try to hit pause, it says its not running.

https://community.platformio.org/t/esp32-pio-unified-debugger/4541/91

Seems this error may be related? Cannot read property ‘getTreeNode’ of null. Error from console.

/Applications/Visual Studio Code.app/Contents/Resources/app/out/vs/workbench/workbench.main.js:2509 Error: Cannot read property ‘getTreeNode’ of null
at r.TreeItem.t.RegisterTreeProvider.getTreeItem (/Users/waltermarchewka/.vscode/extensions/platformio.platformio-ide-1.6.0/node_modules/platformio-vscode-debug/dist/extension.js:1:41898)
at /Applications/Visual Studio Code.app/Contents/Resources/app/out/vs/workbench/node/extensionHostProcess.js:486:184
at t.asThenable (/Applications/Visual Studio Code.app/Contents/Resources/app/out/vs/workbench/node/extensionHostProcess.js:141:941)
at new Promise ()
at Object.t.asThenable (/Applications/Visual Studio Code.app/Contents/Resources/app/out/vs/workbench/node/extensionHostProcess.js:141:909)
at /Applications/Visual Studio Code.app/Contents/Resources/app/out/vs/workbench/node/extensionHostProcess.js:486:140
at Array.map ()
at /Applications/Visual Studio Code.app/Contents/Resources/app/out/vs/workbench/node/extensionHostProcess.js:486:115
at

I tried pio in Atom, and for the most part debugging works. I can step through line by line. I do get an error saying “Source file not available”, and it points to some weird location. But it will debug. So that means the issue lie with vscode. Any ideas?

Narrowed it down a little further. It seems if i add breakpoints in via platformio.ini, they work !

debug_init_break = break main.cpp:10

So it seems as if the breakpoints from vscode arent getting recognized.

Debug is working. Seems one of the issues is that the code i had that previously worked on the ESP-DEVKIT used some of the JTAG pins. Whoops. So thats why a simple HELLO WORLD worked and my code didn’t. I am still having the issue of the breakpoint not working when set in VSCODE. If i have a breakpoint set in vscode, then debug, it wil stop at the first temporary point, then when continued IT will stop at the breakpoint i have set but i cannot do anything after this. This is no continue, or step. I must stop and restart the debugger.
However, if i set a breakpoint in platformio.ini, it will stop at that breakpoint and then will work as advertised. I can toggle breakpoints anywhere in the program and they will stop. I can step or i can continue and set another breakpoint. So this work around works for now.

Hi, i have the similar problem, i want to debug in VSCode, Arduino project on ESP-Wrover-Kit.
My Host :ubuntu 18
After the debug sessions, together with Ivan, we have found the following issues:

  1. For Wriver-Kit the PSRAM must be disabled
    line form platform.ini:
    build_unfl gs = -DBOARD_HAS_PSRAM -mfix-esp32-psram-cache-issue

  2. To start debugging, the count of breakpoints must be smaller then 2.
    It’s the issu in ESP32 openocd.

Ivan will post the issue to espressif , for their implementation of openocd

1 Like

Not sure I see how its a openocd problem as I see same on MacOS with VScode, but works fine with Atom.

ie. BP hits but no continue unless BP is set in .ini using VScode

BP functions as expected in Atom

Could you try this instruction The debugging of the Arduino Framework fails with FTDI Chip and ESP WROVER KIT · Issue #1871 · platformio/platformio-core · GitHub ?

Thanks Ivan, yes this works, thanks