Hello everyone,
im quite new to ESP-32 development. I tried to debug my board with the esp-prog debugger.
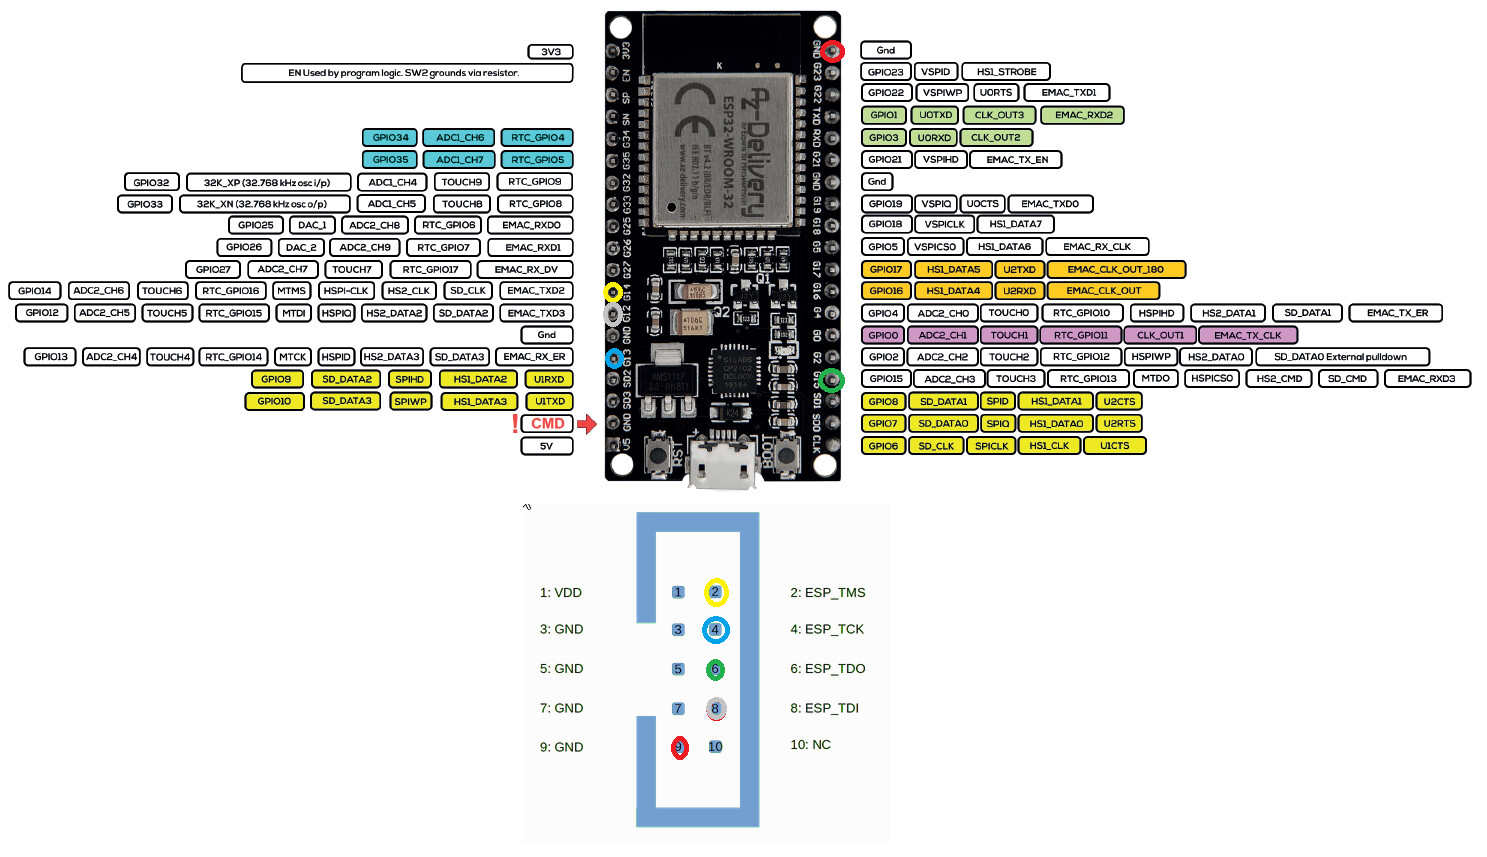
My Board: ESP32 NODEMCU Module WiFi Dev Kit C Development Board with CP2102 – AZ-Delivery
Im using GND(Upper Right), G15, G13, G12, G14
My ESP-PROG: https://www.amazon.de/TOOGOO-ESP-Prog-Programm-Entwicklung-Kompatibel-schwarz/dp/B07V2LBC4Y/ref=sr_1_1?dchild=1&keywords=ESP-Prog+Jtag&qid=1611230967&s=ce-de&sr=1-1
Pins: TMS, TCK, TDO, TDI, GND
Powerconnection via USB.
I am programming with the Arduino Framework but got some bugs lately and wanted to debug it. i Followed the instructions tried it several times but everytime i get the same errors. It seems that the Debugging is working but it does not go to the brakepoints. I used Zadik for the driver like in the tutorial.
This is my Output:
PlatformIO Unified Debugger →
PlatformIO: debug_tool = esp-prog
PlatformIO: Initializing remote target…
Open On-Chip Debugger v0.10.0-esp32-20201202 (2020-12-02-17:38)
Licensed under GNU GPL v2
For bug reports, read
OpenOCD: Bug Reporting
adapter speed: 20000 kHzWARNING: boards/esp-wroom-32.cfg is deprecated, and may be removed in a future release.
Info : FreeRTOS creation
Info : FreeRTOS creation
adapter speed: 5000 kHzInfo : tcl server disabled
Info : telnet server disabled
Error: libusb_open() failed with LIBUSB_ERROR_NOT_SUPPORTED
Info : clock speed 5000 kHz
Info : JTAG tap: esp32.cpu0 tap/device found: 0x120034e5 (mfg: 0x272 (Tensilica), part: 0x2003, ver: 0x1)
Info : JTAG tap: esp32.cpu1 tap/device found: 0x120034e5 (mfg: 0x272 (Tensilica), part: 0x2003, ver: 0x1)
Info : accepting ‘gdb’ connection from pipe
Warn : No symbols for FreeRTOS!
Info : esp32.cpu0: Target halted, PC=0x4000874D, debug_reason=00000000
Info : Set GDB target to ‘esp32.cpu0’
Info : esp32.cpu1: Target halted, PC=0x400076DD, debug_reason=00000000
Info : esp32.cpu0: Target halted, PC=0x40091856, debug_reason=00000001
Info : Flash mapping 0: 0x10020 → 0x3f400020, 202 KB
Info : Flash mapping 1: 0x50018 → 0x400d0018, 480 KB
Info : esp32.cpu0: Target halted, PC=0x40091856, debug_reason=00000001
Info : Auto-detected flash bank ‘esp32.cpu0.flash’ size 4096 KB
Info : Using flash bank ‘esp32.cpu0.flash’ size 4096 KB
Info : esp32.cpu0: Target halted, PC=0x40091856, debug_reason=00000001
Info : Flash mapping 0: 0x10020 → 0x3f400020, 202 KB
Info : Flash mapping 1: 0x50018 → 0x400d0018, 480 KB
Info : Using flash bank ‘esp32.cpu0.irom’ size 484 KB
Info : esp32.cpu0: Target halted, PC=0x40091856, debug_reason=00000001
Info : Flash mapping 0: 0x10020 → 0x3f400020, 202 KB
Info : Flash mapping 1: 0x50018 → 0x400d0018, 480 KB
Info : Using flash bank ‘esp32.cpu0.drom’ size 204 KB
Info : New GDB Connection: 1, Target esp32.cpu0, state: halted
0x4000874d in ?? ()
Info : JTAG tap: esp32.cpu0 tap/device found: 0x120034e5 (mfg: 0x272 (Tensilica), part: 0x2003, ver: 0x1)
Info : JTAG tap: esp32.cpu1 tap/device found: 0x120034e5 (mfg: 0x272 (Tensilica), part: 0x2003, ver: 0x1)
JTAG tap: esp32.cpu0 tap/device found: 0x120034e5 (mfg: 0x272 (Tensilica), part: 0x2003, ver: 0x1)
JTAG tap: esp32.cpu1 tap/device found: 0x120034e5 (mfg: 0x272 (Tensilica), part: 0x2003, ver: 0x1)
Info : esp32.cpu0: Debug controller was reset.
Info : esp32.cpu0: Core was reset.
esp32.cpu0: Debug controller was reset.
esp32.cpu0: Core was reset.
Info : esp32.cpu0: Target halted, PC=0x500000CF, debug_reason=00000000
esp32.cpu0: Target halted, PC=0x500000CF, debug_reason=00000000
Info : esp32.cpu0: Core was reset.
esp32.cpu0: Core was reset.
Info : esp32.cpu0: Target halted, PC=0x40000400, debug_reason=00000000
Info : esp32.cpu1: Debug controller was reset.
Info : esp32.cpu1: Core was reset.
esp32.cpu0: Target halted, PC=0x40000400, debug_reason=00000000
esp32.cpu1: Debug controller was reset.
esp32.cpu1: Core was reset.
Info : esp32.cpu1: Target halted, PC=0x40000400, debug_reason=00000000
esp32.cpu1: Target halted, PC=0x40000400, debug_reason=00000000
** Programming Started **
** Programming Started **
Info : esp32.cpu0: Target halted, PC=0x40091856, debug_reason=00000001
esp32.cpu0: Target halted, PC=0x40091856, debug_reason=00000001
Info : esp32.cpu0: Target halted, PC=0x40091856, debug_reason=00000001
esp32.cpu0: Target halted, PC=0x40091856, debug_reason=00000001
** Programming Finished **
** Programming Finished **
** Verify Started **
** Verify Started **
Info : esp32.cpu0: Target halted, PC=0x40091856, debug_reason=00000001
esp32.cpu0: Target halted, PC=0x40091856, debug_reason=00000001
** Verified OK **
** Verified OK **
Info : JTAG tap: esp32.cpu0 tap/device found: 0x120034e5 (mfg: 0x272 (Tensilica), part: 0x2003, ver: 0x1)
Info : JTAG tap: esp32.cpu1 tap/device found: 0x120034e5 (mfg: 0x272 (Tensilica), part: 0x2003, ver: 0x1)
JTAG tap: esp32.cpu0 tap/device found: 0x120034e5 (mfg: 0x272 (Tensilica), part: 0x2003, ver: 0x1)
JTAG tap: esp32.cpu1 tap/device found: 0x120034e5 (mfg: 0x272 (Tensilica), part: 0x2003, ver: 0x1)
Info : esp32.cpu0: Debug controller was reset.
Info : esp32.cpu0: Core was reset.
esp32.cpu0: Debug controller was reset.
esp32.cpu0: Core was reset.
Info : esp32.cpu0: Target halted, PC=0x500000CF, debug_reason=00000000
esp32.cpu0: Target halted, PC=0x500000CF, debug_reason=00000000
Info : esp32.cpu0: Core was reset.
esp32.cpu0: Core was reset.
Info : esp32.cpu0: Target halted, PC=0x40000400, debug_reason=00000000
Info : esp32.cpu1: Debug controller was reset.
Info : esp32.cpu1: Core was reset.
esp32.cpu0: Target halted, PC=0x40000400, debug_reason=00000000
esp32.cpu1: Debug controller was reset.
esp32.cpu1: Core was reset.
Info : esp32.cpu1: Target halted, PC=0x40000400, debug_reason=00000000
esp32.cpu1: Target halted, PC=0x40000400, debug_reason=00000000
** Programming Started **
** Programming Started **
Info : esp32.cpu0: Target halted, PC=0x40091856, debug_reason=00000001
esp32.cpu0: Target halted, PC=0x40091856, debug_reason=00000001
Info : esp32.cpu0: Target halted, PC=0x40091856, debug_reason=00000001
esp32.cpu0: Target halted, PC=0x40091856, debug_reason=00000001
** Programming Finished **
** Verify Started **
** Programming Finished **
** Verify Started **
Info : esp32.cpu0: Target halted, PC=0x40091856, debug_reason=00000001
esp32.cpu0: Target halted, PC=0x40091856, debug_reason=00000001
** Verified OK **
** Verified OK **
Info : JTAG tap: esp32.cpu0 tap/device found: 0x120034e5 (mfg: 0x272 (Tensilica), part: 0x2003, ver: 0x1)
Info : JTAG tap: esp32.cpu1 tap/device found: 0x120034e5 (mfg: 0x272 (Tensilica), part: 0x2003, ver: 0x1)
JTAG tap: esp32.cpu0 tap/device found: 0x120034e5 (mfg: 0x272 (Tensilica), part: 0x2003, ver: 0x1)
JTAG tap: esp32.cpu1 tap/device found: 0x120034e5 (mfg: 0x272 (Tensilica), part: 0x2003, ver: 0x1)
Info : esp32.cpu0: Debug controller was reset.
Info : esp32.cpu0: Core was reset.
esp32.cpu0: Debug controller was reset.
esp32.cpu0: Core was reset.
Info : esp32.cpu0: Target halted, PC=0x500000CF, debug_reason=00000000
esp32.cpu0: Target halted, PC=0x500000CF, debug_reason=00000000
Info : esp32.cpu0: Core was reset.
esp32.cpu0: Core was reset.
Info : esp32.cpu0: Target halted, PC=0x40000400, debug_reason=00000000
Info : esp32.cpu1: Debug controller was reset.
Info : esp32.cpu1: Core was reset.
esp32.cpu0: Target halted, PC=0x40000400, debug_reason=00000000
esp32.cpu1: Debug controller was reset.
esp32.cpu1: Core was reset.
Info : esp32.cpu1: Target halted, PC=0x40000400, debug_reason=00000000
esp32.cpu1: Target halted, PC=0x40000400, debug_reason=00000000
** Programming Started **
** Programming Started **
Info : esp32.cpu0: Target halted, PC=0x40091856, debug_reason=00000001
esp32.cpu0: Target halted, PC=0x40091856, debug_reason=00000001
Info : esp32.cpu0: Target halted, PC=0x40091856, debug_reason=00000001
esp32.cpu0: Target halted, PC=0x40091856, debug_reason=00000001
** Programming Finished **
** Programming Finished **
** Verify Started **
** Verify Started **
Info : esp32.cpu0: Target halted, PC=0x40091856, debug_reason=00000001
esp32.cpu0: Target halted, PC=0x40091856, debug_reason=00000001
** Verified OK **
** Verified OK **
Info : JTAG tap: esp32.cpu0 tap/device found: 0x120034e5 (mfg: 0x272 (Tensilica), part: 0x2003, ver: 0x1)
Info : JTAG tap: esp32.cpu1 tap/device found: 0x120034e5 (mfg: 0x272 (Tensilica), part: 0x2003, ver: 0x1)
JTAG tap: esp32.cpu0 tap/device found: 0x120034e5 (mfg: 0x272 (Tensilica), part: 0x2003, ver: 0x1)
JTAG tap: esp32.cpu1 tap/device found: 0x120034e5 (mfg: 0x272 (Tensilica), part: 0x2003, ver: 0x1)
Info : esp32.cpu0: Debug controller was reset.
Info : esp32.cpu0: Core was reset.
esp32.cpu0: Debug controller was reset.
esp32.cpu0: Core was reset.
Info : esp32.cpu0: Target halted, PC=0x500000CF, debug_reason=00000000
esp32.cpu0: Target halted, PC=0x500000CF, debug_reason=00000000
Info : esp32.cpu0: Core was reset.
esp32.cpu0: Core was reset.
Info : esp32.cpu0: Target halted, PC=0x40000400, debug_reason=00000000
Info : esp32.cpu1: Debug controller was reset.
Info : esp32.cpu1: Core was reset.
esp32.cpu0: Target halted, PC=0x40000400, debug_reason=00000000
esp32.cpu1: Debug controller was reset.
esp32.cpu1: Core was reset.
Info : esp32.cpu1: Target halted, PC=0x40000400, debug_reason=00000000
esp32.cpu1: Target halted, PC=0x40000400, debug_reason=00000000
** Programming Started **
** Programming Started **
Info : esp32.cpu0: Target halted, PC=0x40091856, debug_reason=00000001
esp32.cpu0: Target halted, PC=0x40091856, debug_reason=00000001
Info : esp32.cpu0: Target halted, PC=0x40091856, debug_reason=00000001
esp32.cpu0: Target halted, PC=0x40091856, debug_reason=00000001
** Programming Finished **
** Verify Started **
** Programming Finished **
** Verify Started **
Info : esp32.cpu0: Target halted, PC=0x40091856, debug_reason=00000001
esp32.cpu0: Target halted, PC=0x40091856, debug_reason=00000001
** Verified OK **
** Verified OK **
Info : JTAG tap: esp32.cpu0 tap/device found: 0x120034e5 (mfg: 0x272 (Tensilica), part: 0x2003, ver: 0x1)
Info : JTAG tap: esp32.cpu1 tap/device found: 0x120034e5 (mfg: 0x272 (Tensilica), part: 0x2003, ver: 0x1)
JTAG tap: esp32.cpu0 tap/device found: 0x120034e5 (mfg: 0x272 (Tensilica), part: 0x2003, ver: 0x1)
JTAG tap: esp32.cpu1 tap/device found: 0x120034e5 (mfg: 0x272 (Tensilica), part: 0x2003, ver: 0x1)
Info : esp32.cpu0: Debug controller was reset.
Info : esp32.cpu0: Core was reset.
esp32.cpu0: Debug controller was reset.
esp32.cpu0: Core was reset.
Info : esp32.cpu0: Target halted, PC=0x500000CF, debug_reason=00000000
esp32.cpu0: Target halted, PC=0x500000CF, debug_reason=00000000
Info : esp32.cpu0: Core was reset.
esp32.cpu0: Core was reset.
Info : esp32.cpu0: Target halted, PC=0x40000400, debug_reason=00000000
Info : esp32.cpu1: Debug controller was reset.
Info : esp32.cpu1: Core was reset.
esp32.cpu0: Target halted, PC=0x40000400, debug_reason=00000000
esp32.cpu1: Debug controller was reset.
esp32.cpu1: Core was reset.
Info : esp32.cpu1: Target halted, PC=0x40000400, debug_reason=00000000
esp32.cpu1: Target halted, PC=0x40000400, debug_reason=00000000
Temporary breakpoint 1 at 0x400d1520: file src\main_u8g2.cpp, line 238.
PlatformIO: Initialization completed
PlatformIO: Resume the execution todebug_init_break = tbreak setup
PlatformIO: More configuration options → Redirecting...
Note: automatically using hardware breakpoints for read-only addresses.
Info : esp32.cpu0: Target halted, PC=0x40008744, debug_reason=00000000
Info : Set GDB target to ‘esp32.cpu0’
esp32.cpu0: Target halted, PC=0x40008744, debug_reason=00000000
Set GDB target to ‘esp32.cpu0’
Info : esp32.cpu1: Target halted, PC=0x400076DD, debug_reason=00000000
esp32.cpu1: Target halted, PC=0x400076DD, debug_reason=00000000Program received signal
SIGINT, Interrupt.
0x40008744 in ?? ()
Uploading to the chip and halting the core looks good. The debugger seems to break in some point in flash or ROM where it doesn’t know the function name.
What’s the platformio.ini? Have you tried setting debug_init_break = tbreak setup so that it definitely breaks in the setup() function?
Thanks for Replying,
yes my platform.ini looks like this:
[env:esp32dev]
platform = espressif32
board = esp32dev
framework = arduino
upload_port = COM8
monitor_speed = 115200
debug_tool = esp-prog
debug_init_break = tbreak setup
lib_deps =
SPI
Wire
GxEPD
adafruit/Adafruit BusIO @ ^1.6.0
adafruit/Adafruit GFX Library @ ^1.10.2
olikraus/U8g2 @ ^2.28.8
bblanchon/ArduinoJson @ ^6.17.2
knolleary/PubSubClient @ ^2.8
What about this Error?
Error: libusb_open() failed with LIBUSB_ERROR_NOT_SUPPORTED
And line 238 is where setup() is?
What does the VSCode windows look like once the output SIGINT, Interrupt appears?
OpenOCD tries to open a few interfaces and fails with the wrong ones, then succeeds at the right one – can be ignored.
I set to Brakepoint one on line 237 Where setup() is and one on 244 for testing but this doesn’t made a differenz. First Picture without doing anything and Second Picture after Pause
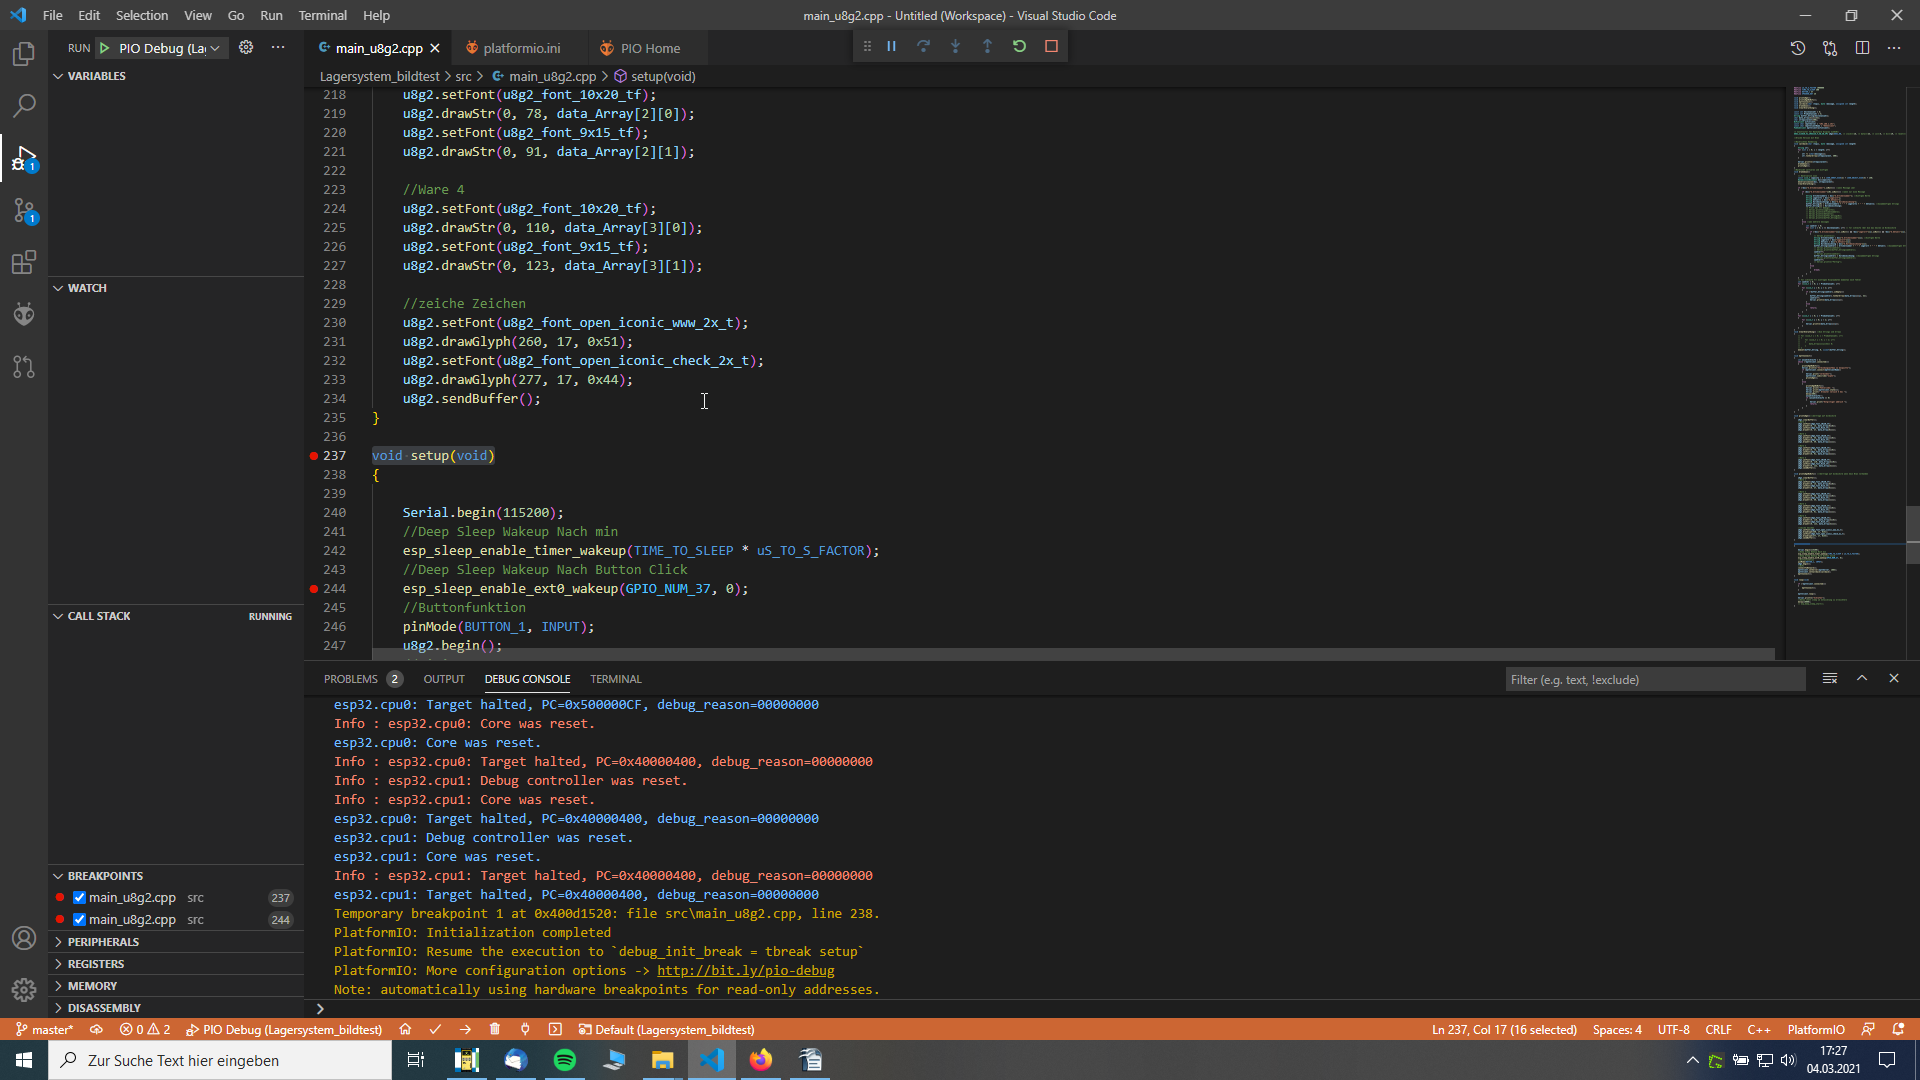
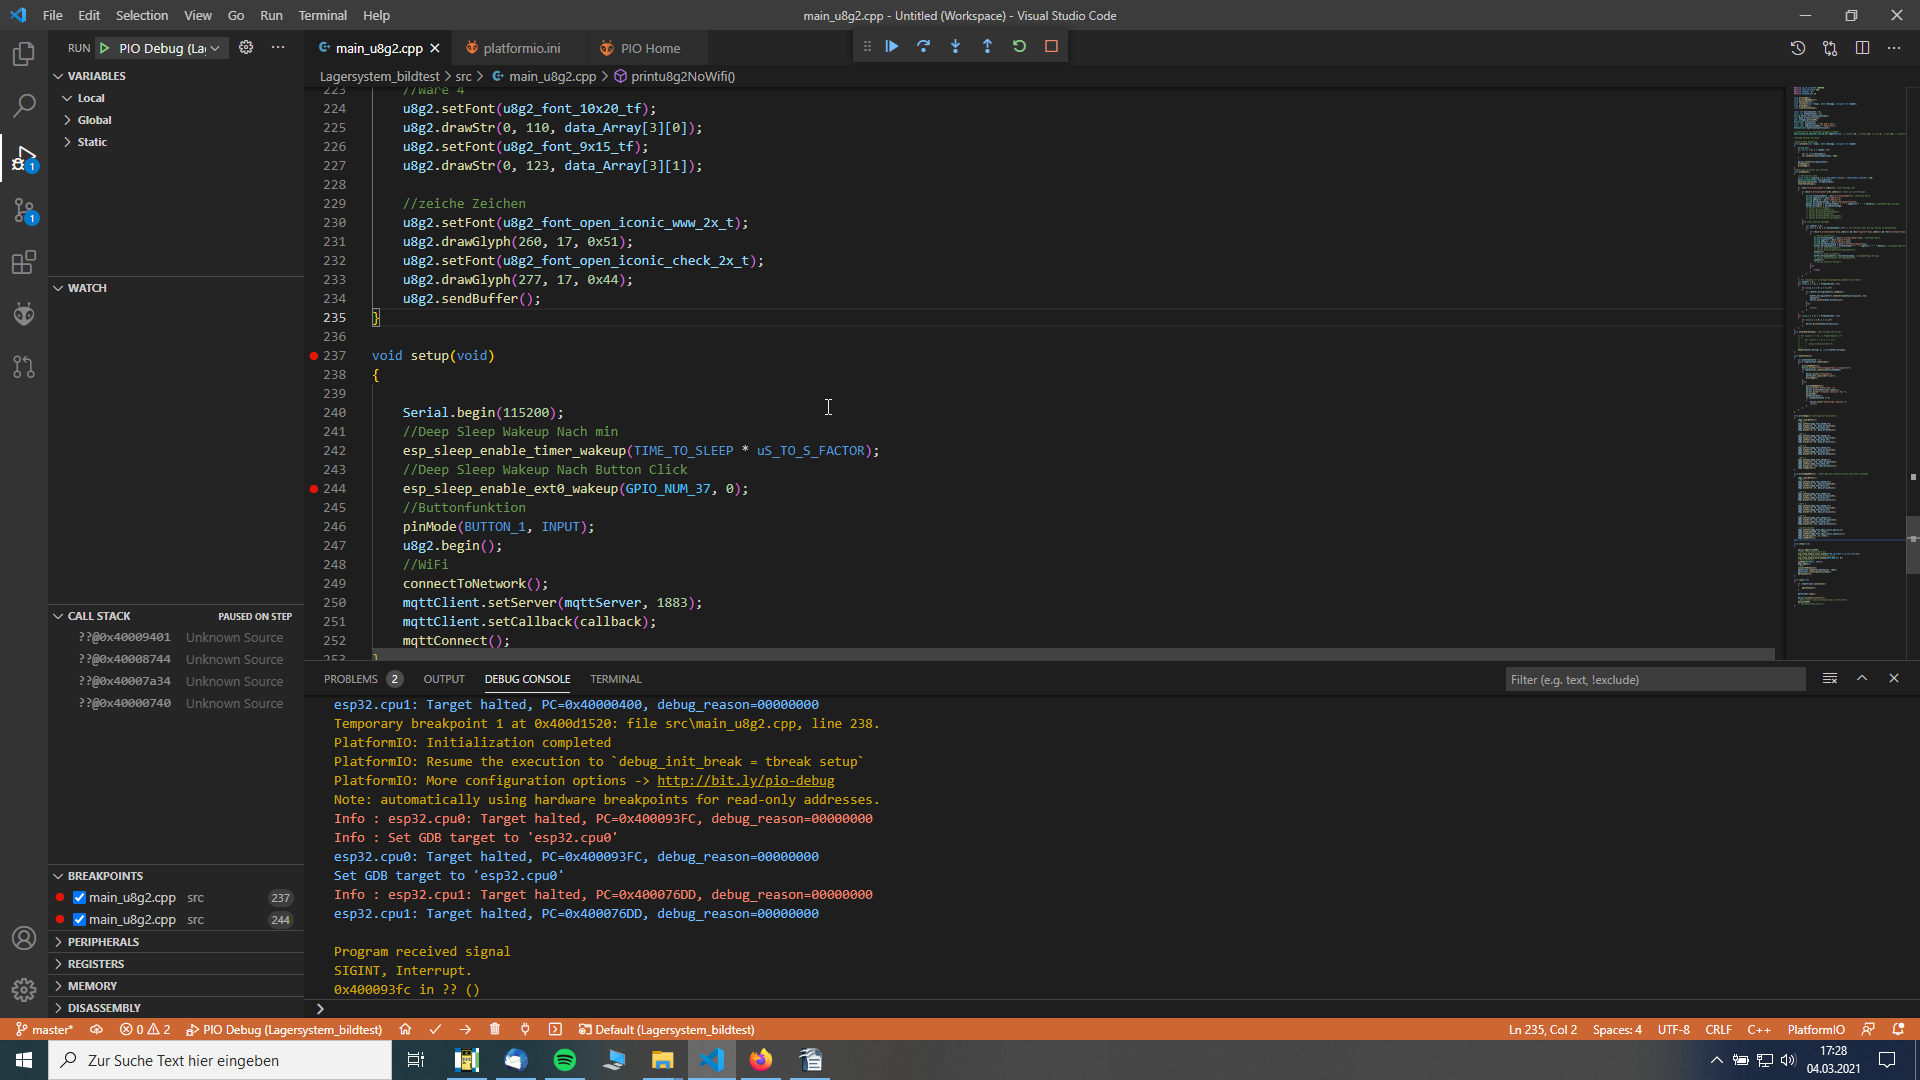
What happens when you press the “pause” button in that moment?
What happens when you stop debugging, then remove all your two own set breakpoints and start debugging again? (The ESP32 has a lot of quirks regarding the number of available breakpoints and other stuff)
This is when i click Nothing:
Info : esp32.cpu1: Target halted, PC=0x40000400, debug_reason=00000000
esp32.cpu1: Target halted, PC=0x40000400, debug_reason=00000000
Temporary breakpoint 1 at 0x400d1520: file src\main_u8g2.cpp, line 238.
PlatformIO: Initialization completed
PlatformIO: Resume the execution todebug_init_break = tbreak setup
PlatformIO: More configuration options → Redirecting...
Note: automatically using hardware breakpoints for read-only addresses.
This after Pause:
Info : esp32.cpu0: Target halted, PC=0x40009406, debug_reason=00000000
Info : Set GDB target to ‘esp32.cpu0’
esp32.cpu0: Target halted, PC=0x40009406, debug_reason=00000000
Set GDB target to ‘esp32.cpu0’
Info : esp32.cpu1: Target halted, PC=0x400076DD, debug_reason=00000000
esp32.cpu1: Target halted, PC=0x400076DD, debug_reason=00000000
Program received signal
SIGINT, Interrupt.
0x40009406 in ?? ()
Step Over Nothing Hapened, also with Step into.
This is Step out Message:
Warn : address 0x40008744 not writable
Error: esp32.cpu0: Failed to write breakpoint instruction (-4)!
Error: esp32.cpu0: Failed to add SW breakpoint!
Error: can’t add breakpoint: unknown reason
All with no Own Brakepoints now
Also this poped up after Step Out now:
Could not expand variable: Target is executing. (from stack-list-variables --thread 1 --frame 0 --simple-values)
Someone have any Idea i didnt get a solution yet?
What happens when you press the reset button after debugging has started?
Is the reset line / TRST correctly connected between the adapters? Maybe try new cables?
Reset button on the ESP Prog or ESP-32?
Try both buttons, I’d say
It looks like breakpoints were inserted at the wrong addresses. I think the partition table has not been updated to match the ELF settings. Try flashing the new table on to the chip. That should fix the problem.
Thats the message when i click Reset on Debugger:
Info : esp32.cpu0: Debug controller was reset.
Info : esp32.cpu0: Core was reset.
Info : esp32.cpu1: Debug controller was reset.
Info : esp32.cpu1: Core was reset.
esp32.cpu0: Debug controller was reset.
esp32.cpu0: Core was reset.
esp32.cpu1: Debug controller was reset.
esp32.cpu1: Core was reset.
After Reset on ESP-32 and clicking pause and step Forward:
Program received signal
SIGINT, Interrupt.
0x40000400 in ?? ()
Warn : esp32.cpu0: target not halted
Info : target esp32.cpu0 was not halted when step was requested
esp32.cpu0: target not halted
target esp32.cpu0 was not halted when step was requested
Info : The target is not running when halt was requested, stopping GDB.
Warn : target esp32.cpu0 is not halted (gdb fileio)
Error: Failed to find HALTED core!
The target is not running when halt was requested, stopping GDB.
Error: Target not examined yet
Can you give me a link how to do it?
Follow the instructions here.
https://docs.espressif.com/projects/esp-idf/en/latest/esp32/get-started/index.html
That will install the command line version of ESP32 development tools. Follow the procedure up to and including step 9. After that, the Platformio debugger should work until you do something to change the partition table.
Now it works but often i get another error:
Failed to launch GDB: .pioinit:11: Error in sourced command file:
Remote communication error. Target disconnected.: No error. (from interpreter-exec console “source .pioinit”)
Also the debug is very slow and sometimes it just stops on the way in the next row.
Slow down the JTAG clock by including this in platformio.ini
debug_speed = 12000
Stepping through code is slow on my system as well, 3 to 5 secs per step. I’ve seen it go much faster in other peoples’ setups.