after several trials no more ideas …
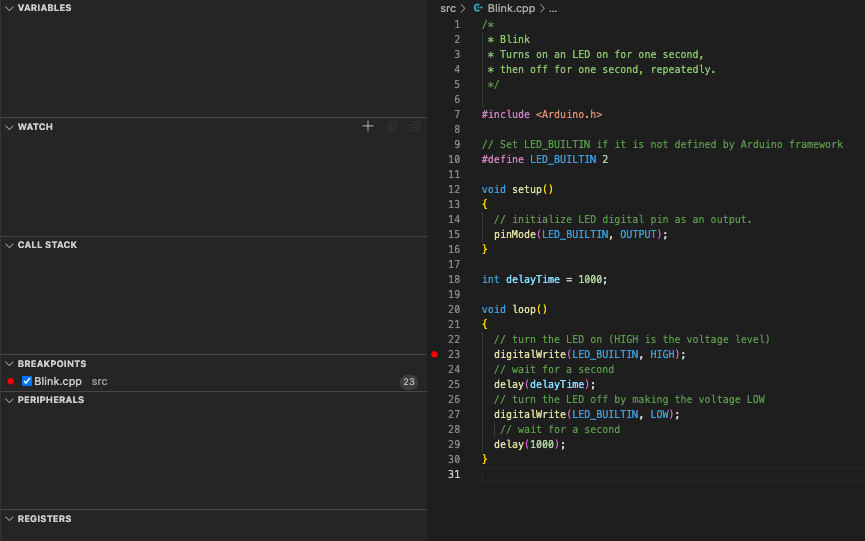
Simple Blink project would try to debug (ESP-Prog):
Build in debug mode, Platformio also connect to ESP-Prog.
but NO SYMBOLS !!!
Terminal says:
Processing esp32-debug (platform: espressif32; framework: arduino; board: az-delivery-devkit-v4)
Verbose mode can be enabled via `-v, --verbose` option
CONFIGURATION: https://docs.platformio.org/page/boards/espressif32/az-delivery-devkit-v4.html
PLATFORM: Espressif 32 (3.2.0) > AZ-Delivery ESP-32 Dev Kit C V4
HARDWARE: ESP32 240MHz, 520KB RAM, 16MB Flash
DEBUG: Current (esp-prog) External (esp-prog, iot-bus-jtag, jlink, minimodule, olimex-arm-usb-ocd, olimex-arm-usb-ocd-h, olimex-arm-usb-tiny-h, olimex-jtag-tiny, tumpa)
PACKAGES:
 - framework-arduinoespressif32 3.10006.210326 (1.0.6)
 - tool-esptoolpy 1.30000.201119 (3.0.0)
 - tool-openocd-esp32 2.1000.20201202 (10.0)
 - toolchain-xtensa32 2.50200.97 (5.2.0)
LDF: Library Dependency Finder -> http://bit.ly/configure-pio-ldf
LDF Modes: Finder ~ chain, Compatibility ~ soft
Found 28 compatible libraries
Scanning dependencies...
No dependencies
Building in debug mode
Retrieving maximum program size .pio/build/esp32-debug/firmware.elf
Checking size .pio/build/esp32-debug/firmware.elf
Advanced Memory Usage is available via "PlatformIO Home > Project Inspect"
RAM:   [          ]   2.5% (used 13384 bytes from 532480 bytes)
Flash: [==        ]  15.4% (used 201834 bytes from 1310720 bytes)
====================================================================================== [SUCCESS] Took 1.11 seconds ======================================================================================

Environment    Status    Duration
-------------  --------  ------------
esp32-debug    SUCCESS   00:00:01.106
====================================================================================== 1 succeeded in 00:00:01.106 ======================================================================================

Terminal will be reused by tasks, press any key to close it.
DEBUGGER SAYS:
undefinedOpen On-Chip Debugger  v0.10.0-esp32-20201202 (2020-12-02-17:38)
Licensed under GNU GPL v2
For bug reports, read
	http://openocd.org/doc/doxygen/bugs.html
adapter speed: 20000 kHz

WARNING: boards/esp-wroom-32.cfg is deprecated, and may be removed in a future release.
2
Info : FreeRTOS creation
adapter speed: 5000 kHz

Info : Listening on port 6666 for tcl connections
Info : Listening on port 4444 for telnet connections
Info : clock speed 5000 kHz
Info : JTAG tap: esp32.cpu0 tap/device found: 0x120034e5 (mfg: 0x272 (Tensilica), part: 0x2003, ver: 0x1)
Info : JTAG tap: esp32.cpu1 tap/device found: 0x120034e5 (mfg: 0x272 (Tensilica), part: 0x2003, ver: 0x1)
Info : esp32.cpu0: Target halted, PC=0x40087652, debug_reason=00000001
Info : esp32.cpu1: Target halted, PC=0x400E42DE, debug_reason=00000000
Info : Listening on port 3333 for gdb connections
Reading symbols from /Users/dressola/Documents/PlatformIO/Projects/210326-193027-arduino-blink/.pio/build/esp32-debug/firmware.elf...
done.
PlatformIO Unified Debugger -> http://bit.ly/pio-debug
PlatformIO: debug_tool = esp-prog
PlatformIO: Initializing remote target...
.pioinit:11: Error in sourced command file:
localhost:10242: Operation timed out.