The ESP32 microcontroller supports in-circuit debugging, i.e. your code can be run on real hardware while stepping through it line by line, running to the next breakpoint, inspecting variables etc. These instructions help you set up debugging, both for Arduino and ESP-IDF projects.
Unfortunately, ESP32 debugging is unreliable as there are many things that can go wrong. Thus, this post also contains a long troubleshooting section.
Debugging Instructions
Hardware Setup
To debug an ESP32 microcontroller, a JTAG debug adapter is needed. The most common one is the ESP-Prog board from Espressif. Alternatives are FT2232HL and FT232H based adapters (see https://medium.com/@manuel.bl/low-cost-esp32-in-circuit-debugging-dbbee39e508b), Segger J-Link or any other debug adapter with JTAG support. These instructions assume you are using ESP-Prog.
Note: The ESP32-S3 microcontroller provides a built-in JTAG adapter, which is available if a USB connector is fitted, connected to the built-in USB peripheral and not used for something else. Such a setup is not covered here.
The ESP-Prog board is connected via USB to the computer running PlatformIO. The ESP32 development board must also be powered (independently from the ESP-Prog). So it is also connected via USB to the computer.
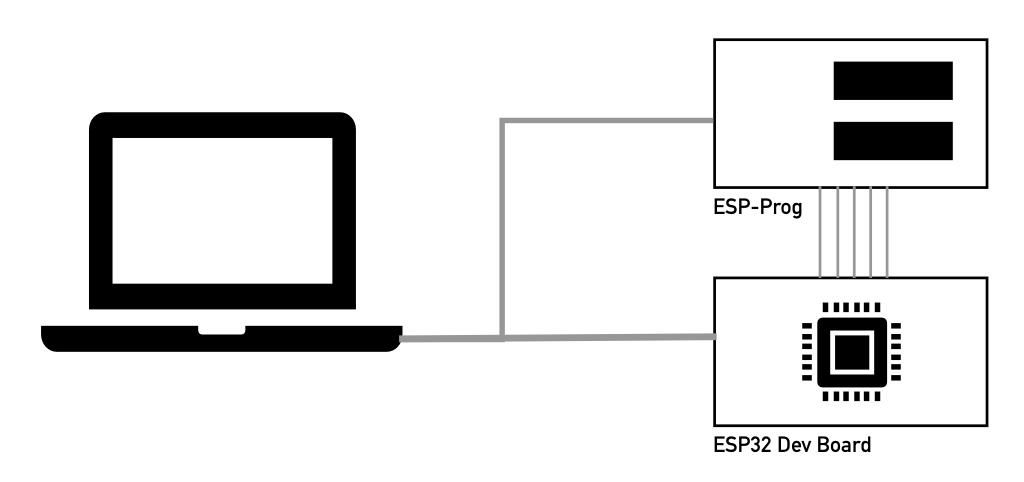
Finally, GND and the JTAG signals must be connected between the ESP-Prog board and the ESP32 development board according to this table:
| JTAG signal | ESP32 | ESP32-S2 | ESP32-S3 |
|---|---|---|---|
| GND | GND | GND | GND |
| TDO | GPIO15 | GPIO40 | GPIO40 |
| TDI | GPIO12 | GPIO41 | GPIO41 |
| TCK | GPIO13 | GPIO39 | GPIO39 |
| TMS | GPIO14 | GPIO42 | GPIO42 |
Software Setup
Driver Configuration
Do not install any drivers
ESP-Prog does not require any drivers. In fact, installing drivers will likely cause additional problems. Some operating systems require driver configuration though:
Linux configuration
On most Linux systems, USB devices are mapped with read-only permissions by default. To allow PlatformIO (or rather OpenOCD) to work with ESP-Prog, add a new udev rule. Create a file at /etc/udev/rules.d/50-espprog.rules with the following content:
SUBSYSTEM=="usb", ATTR{idVendor}=="0403", ATTRS{idProduct}=="6010", MODE="0664", GROUP="plugdev"
Make sure your user is a member of the plugdev group. Then, unplug and reconnect the ESP-Prog board.
PlatformIO has more detailed instructions covering more USB devices at 99-platformio-udev.rules — PlatformIO latest documentation
macOS configuration
No special configuration is needed on the Mac. It should just work.
Windows configuration
By default, Windows will either not install any driver or the wrong one. For ESP32 debugging, interface 0 of ESP-Prog must be using the WinUSB driver.
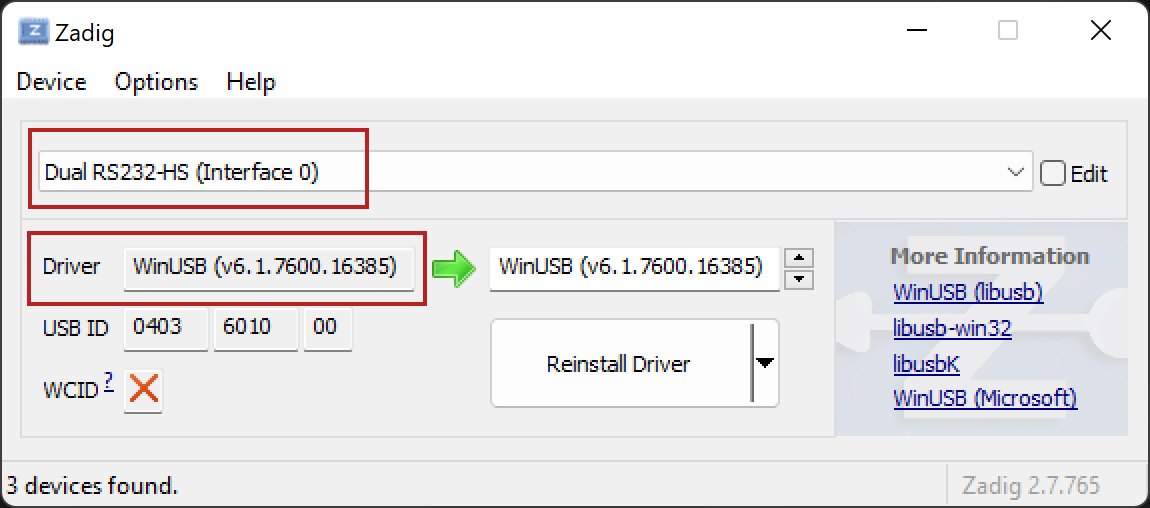
In order to configure this driver, download a tool called Zadig and start it.
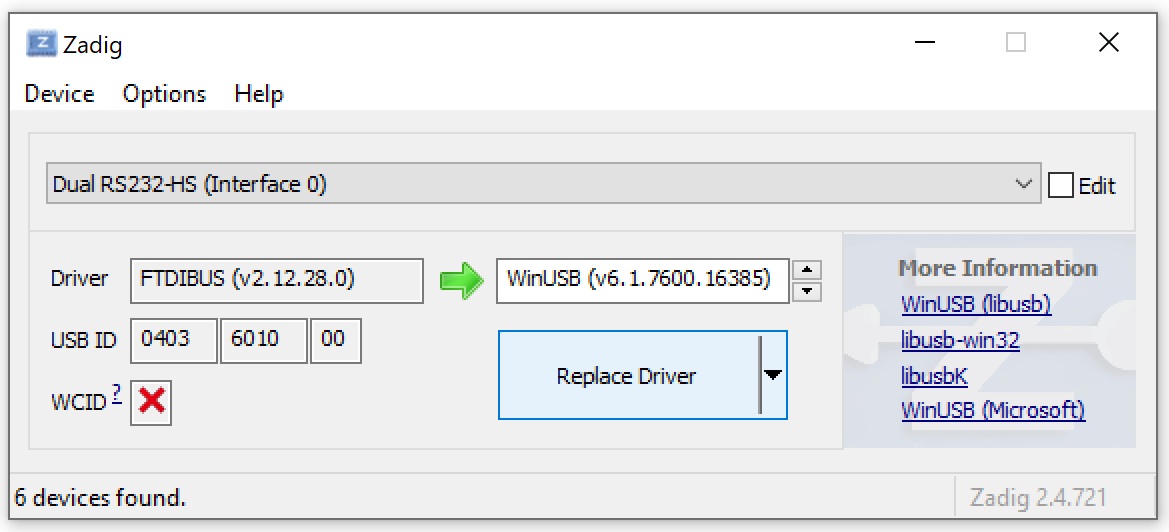
- In the Options menu, check List All Devices
- Select Dual RS232-HS (Interface 0) from the main drop down
- Select WinUSB on the right-hand side of the green arrow (if not already selected)
- Click Replace Driver
Project Configuration
In PlatformIO, only minimal additions to platformio.ini are needed:
debug_tool = esp-progconfigures ESP-Prog as the debug adapterdebug_init_break = tbreak setupis recommended for Arduino projects so the debugger initially stops in thesetup()function (instead of themain()function).upload_protocol = esp-progcan optionally be used to upload the firmware via JTAG (instead of via the serial connection)
A complete platformio.ini file can look like this:
[env:esp32dev]
platform = espressif32
board = esp32dev
framework = arduino
upload_protocol = esp-prog
debug_tool = esp-prog
debug_init_break = tbreak setup
Note that the JTAG adapter does not use serial ports. Thus, no upload port and no debugging port must be specified.
Start Debugging
To run your software with the debugger:
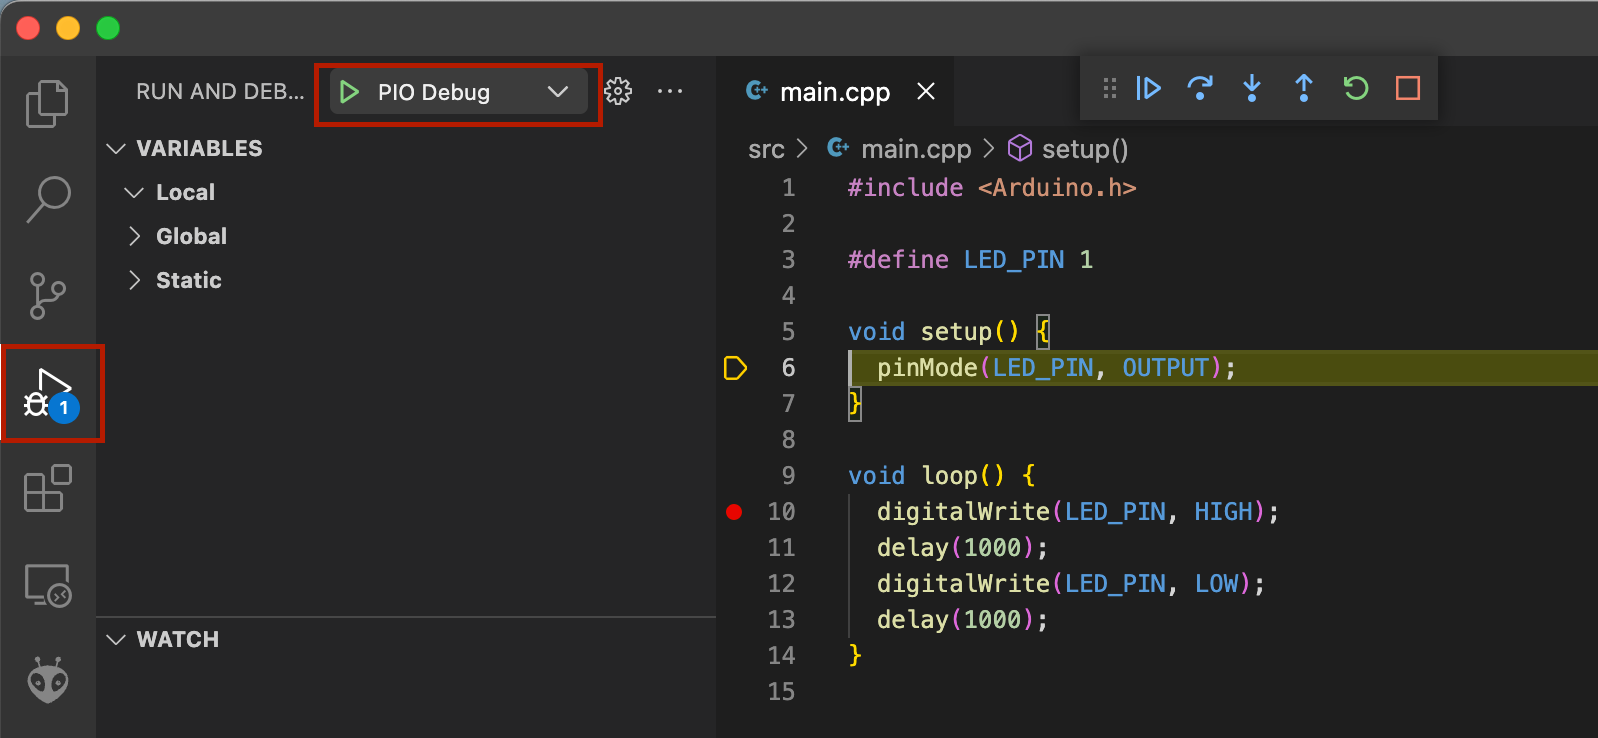
- Select the Debug icon on the left side to open the debugger view
- Click the green triangle icon (Start Debugging) at the top to start your app with the debugger.
- PlatformIO will recompile the software, upload it, run it and stop on the first line of
setup() - You can then set additional breakpoints by clicking left of the line number. A red dot will appear.
Troubleshooting
Troubleshooting approach
As many components are involved, it is important to isolate the problem. In order to do that, it is recommended to:
- Use the simplest possible code like a Blink sketch
- Test the JTAG connection by uploading code (configure
upload_protocol = esp-progand click the upload icon in the status bar) - Then test debugging (still using the Blink sketch)
- Finally, debug using the real code
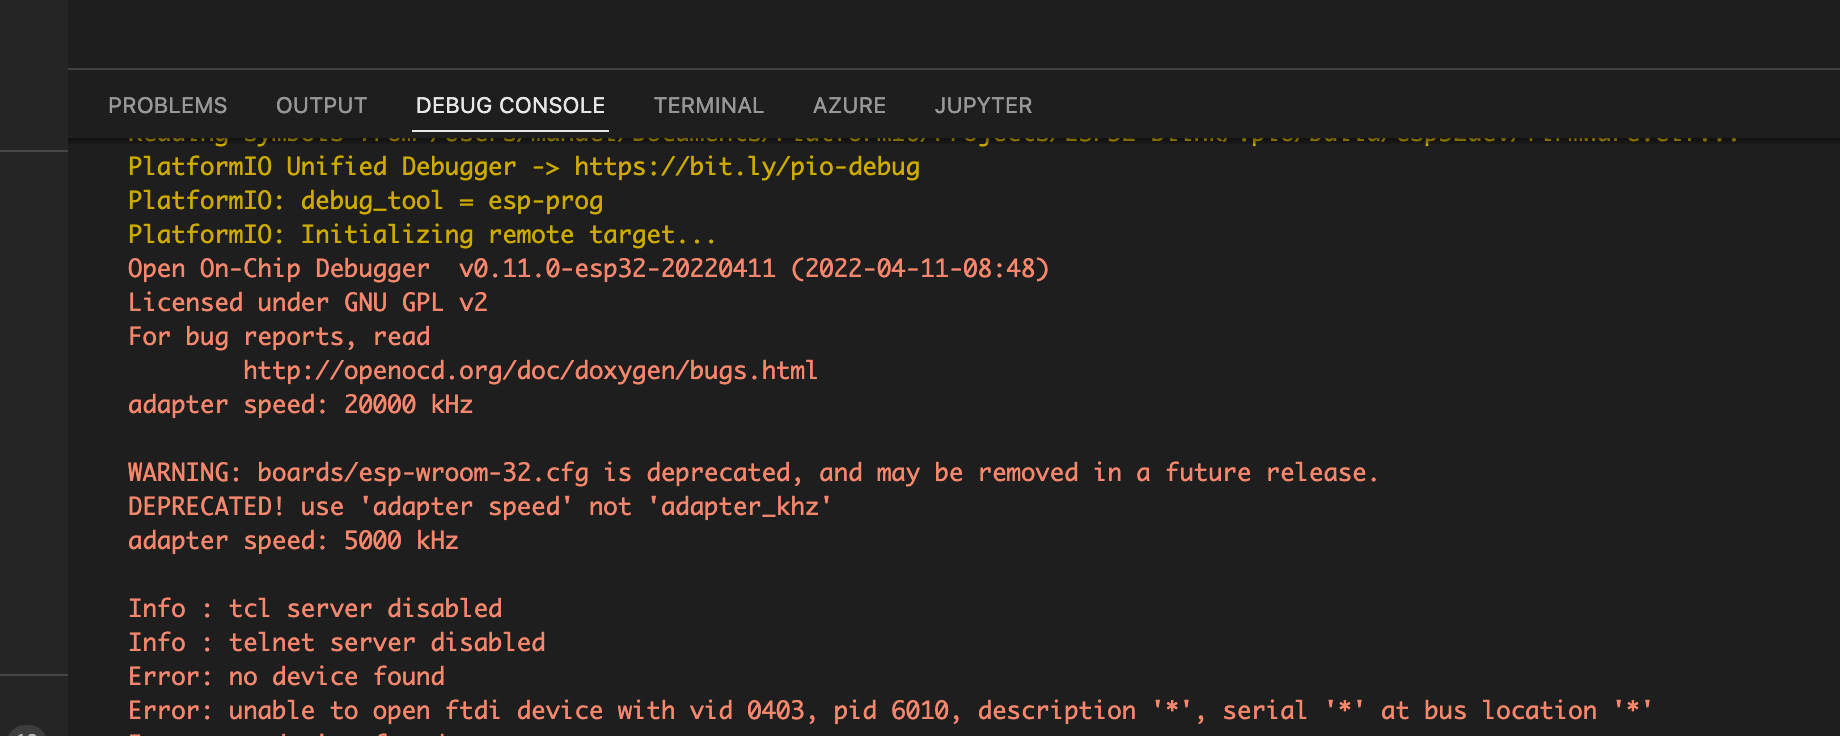
Once a problem is encountered, dig deeper by analyzing the error messages. Most of them will appear in the Debug Console.
The error messages will indicate which part of the setup is causing the issue.
Isolating problem area
Most of the problems are either related to:
- the communication between your computer and the JTAG adapter, or
- the communication between the JTAG adapter and the ESP32 microcontroller.
As a rule of thumb: If the output in the terminal (for upload) or in the debug console (for debugging) contains an error message about “no device found” and then ends about 5 lines later, the communication between computer and JTAG adapter is not working. Otherwise, the problem is between JTAG adapter and ESP32.
Error: no device found
Error: unable to open ftdi device with vid 0403, pid 6010, description '*', serial '*' at bus location '*'
Error: no device found
Error: unable to open ftdi device with vid 0403, pid 6014, description '*', serial '*' at bus location '*'
** OpenOCD init failed **
shutdown command invoked
Note that the output can be confusing: OpenOCD tries several VID/PID combinations. If the first one fails but the second one works, the “no device found” message might appear even though it’s working fine.
Troubleshooting communication between JTAG adapter and ESP32
Most likely cause: wiring
By far the most likely cause of communication problems between JTAG adapter and ESP32 are wiring issues. Hardly any ESP32 board provides a JTAG connector. So several individual wires must be connected, opening the field for mistakes and bad connections.
A strong indication is the below error message (or a similar one with “all zeroes”):
Error: JTAG scan chain interrogation failed: all ones
Thus:
- Check that the correct pins have been connected
- Use short wires
- Connect the wires directly, without going through a breadboard
- If using Dupont wires: push the wire down, not just the black connector housing
- Ensure with a multimeter that all connections are making good contact
- Check and check again
Conflict with JTAG peripheral
In the ESP32 microcontroller, JTAG is a peripheral like UART or I2C. It is enabled by default after reset. But it can be disabled, or software and hardware conflicts can be created. Thus:
- Ensure that the JTAG pins are not used for anything else than JTAG and are not wired to other hardware like buttons, LEDs, pull-down/pull-up resistors, SPI devices etc.
- Do not configure the JTAG pins in any way, be it as a GPIO, UART, SPI etc.
- Ensure your code is not using deep sleep as deep sleep disables the JTAG peripheral
Further things to check
- Check that both the ESP32 board and the JTAG debug adapter are powered independently. The adapter cannot provide sufficient power to the ESP32.
- Check that the ESP32 board and the JTAG adapter have their ground directly connected. It is important for JTAG signal quality. The indirect connection via USB ground or shield is not sufficient.
Troubleshooting communication between computer and JTAG adapter
Most likely cause: USB driver configuration
Communication between the computer and the JTAG adapter either works or doesn’t. There is hardly ever anything in-between. If PlatformIO/OpenOCD can talk to the adapter, it works; if not, the adapter won’t even be “found”.
The main cause are driver configuration issues and they are specific to each operating system.
Linux
If the communication fails, it usually a permission problem with the USB device, which in turn indicates an incorrect or incomplete udev rules setup. Try to follow the instructions at 99-platformio-udev.rules — PlatformIO latest documentation
Note: Two additional serial ports will appear if ESP-Prog is plugged in. For debugging, they are not used. They aren’t a problem either as long as they are not used concurrently.
macOS
The likely cause on macOS are outdated drivers that hold on to the ESP-Prog exclusively. Since macOS Mojave (released in 2019), all Macs come out-of-the-box with drivers for all relevant USB-to-serial chips (FTDI, WCH, SiliconLabs etc.). The drivers are provided by Apple and allow the same USB device to be used with other protocols if the serial port is not open. This non-exclusive access is required for ESP-Prog.
Drivers from the manufacturer can cause problems, are not needed and should be uninstalled. For the FTDI drivers, which could be in conflict with ESP-Prog, these commands can be used to remove the drivers (if they are listed with ls -l):
ls -l /Library/Extensions
sudo kextunload /Library/Extensions/FTDIUSBSerialDriver.kext/
sudo rm -r /Library/Extensions/FTDIUSBSerialDriver.kext/
Also check:
ls -l /System/Library/Extensions
sudo kextunload /System/Library/Extensions/FTDIUSBSerialDriver.kext/
sudo rm -r /System/Library/Extensions/FTDIUSBSerialDriver.kext/
Note: If you connect the ESP-Prog board, two additional serial ports will appear as /dev/cu.usb.... That is to be expected. But do not use the one with the lower number as it would interfere with the use for the JTAG protocol.
Windows
The USB driver architecture on Windows is quite rigid. It’s not possible to use both the general WinUSB driver and a serial port driver at the same time (for a given interface of a USB device). So interface 0 of ESP-Prog must be configured to use the WinUSB driver and the serial port driver must be deactivated.
Use Zadig to verify that Interface 0 of Dual RS232-HS is indeed using WinUSB. WinUSB must appear on the *left-hand side of the green arrow. If not, click Replace Driver again.
Configurations made with Zadig often only apply if the device is plugged in to a specific USB port. So always use the same port to avoid problems, and use Zadig when you change the port.
Further things to check
- Make sure the USB cable to the ESP-Prog can transmit data (some cables are stripped down and are only suitable for power supply)
- Try with a different USB port for ESP-Prog, in particular if you are using a USB hub
- Check that the monitoring port is correct and that you didn’t accidentally specify one of the ESP-Prog ports.