I have burned the fuse to use the JTAG pins for debugging with ESP-PRO on the ESP32-S3-Devkit and have confirmed correct wiring and continuity of the connections. What other hidden details are there for getting the in-circuit working?
Instead of shotgun-debugging the problem by trying random “missing / hidden things”, it’d be better if we saw your platformio.ini, a picture of diagram of your wireup and the error message in the “Debug Console” when you start debugging.
fair enough. Just one moment and I will post it ALL.
platformio.ini:
[platformio]

default_envs = esp32-s3-devkitc-1

[env:esp32-s3-devkitc-1]

platform = espressif32

board = esp32-s3-devkitc-1

board_build.arduino.memory_type = dio_opi

framework = arduino

upload_protocol = esp-prog

debug_tool = esp-prog

debug_speed = 500

debug_init_break = tbreak setup

board_build.partitions = default_partitions.csv

lib_ldf_mode = deep

lib_extra_dirs = ~/Documents/Arduino/libraries

build_flags =

-fmax-errors=5

-I./src/

-I./src/utils/

-I./src/transport/

-I./src/drivers/

-DCORE_DEBUG_LEVEL=5

-DBOARD_HAS_PSRAM

-mfix-esp32-psram-cache-issue

lib_deps =

mikalhart/IridiumSBD@^2.0

sparkfun/SparkFun Swarm Satellite Arduino Library@^1.1.8

sensirion/Sensirion I2C SEN5X@^0.2.0

paulstoffregen/OneWire@^2.3.7

milesburton/DallasTemperature@^3.11.0

adafruit/Adafruit NeoPixel@^1.10.6

;wollewald/ADS1220_WE@^1.0.13 ; NOT USED, using mcpADS1220 based on wollewald's version

adafruit/Adafruit MCP23017 Arduino Library@^2.3.0

SD@^2.0.0 ; SD lib in normal ESP32-S3-devkitc-1 library does not work.

;upload_port = COM13

monitor_speed = 115200

;monitor_port = COM13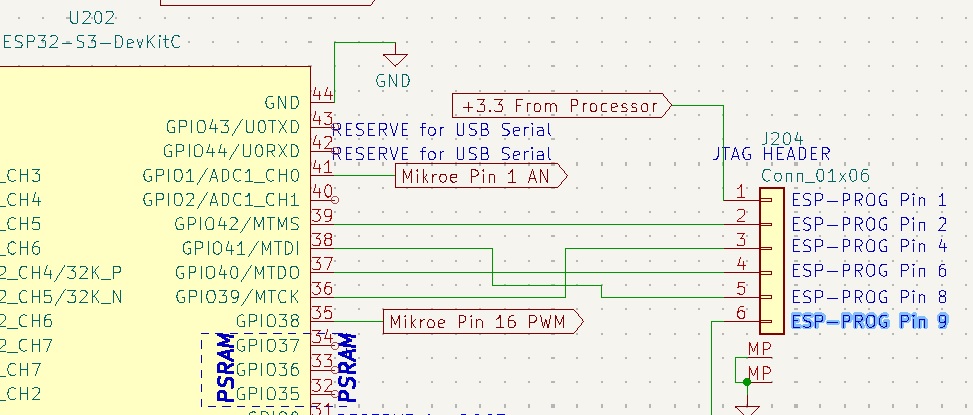
Debug console log:
undefinedC:\Users\peted\.platformio\packages\toolchain-xtensa-esp32s3@8.4.0+2021r2-patch5\bin\xtensa-esp32s3-elf-gdb.exe: warning: Couldn't determine a path for the index cache directory.

Reading symbols from c:\Users\peted\OneDrive\Documents\PlatformIO\Swarm\Tzatziki\.pio\build\esp32-s3-devkitc-1\firmware.elf...
PlatformIO Unified Debugger -> https://bit.ly/pio-debug
PlatformIO: debug_tool = esp-prog
PlatformIO: Initializing remote target...
Open On-Chip Debugger  v0.11.0-esp32-20220706 (2022-07-06-15:48)
Licensed under GNU GPL v2
For bug reports, read
	http://openocd.org/doc/doxygen/bugs.html
adapter speed: 20000 kHz

adapter speed: 500 kHz

Info : tcl server disabled
Info : telnet server disabled
Error: libusb_open() failed with LIBUSB_ERROR_NOT_SUPPORTED
Info : clock speed 500 kHz
Info : JTAG tap: esp32s3.cpu0 tap/device found: 0x120034e5 (mfg: 0x272 (Tensilica), part: 0x2003, ver: 0x1)
Info : JTAG tap: esp32s3.cpu1 tap/device found: 0x120034e5 (mfg: 0x272 (Tensilica), part: 0x2003, ver: 0x1)
Info : [esp32s3.cpu0] Debug controller was reset.
Info : [esp32s3.cpu0] Core was reset.
Info : [esp32s3.cpu1] Debug controller was reset.
Info : [esp32s3.cpu1] Core was reset.
Info : starting gdb server for esp32s3.cpu0 on pipe
Info : accepting 'gdb' connection from pipe
Info : [esp32s3.cpu0] Target halted, PC=0x4202BFDE, debug_reason=00000000
Info : Set GDB target to 'esp32s3.cpu0'
Info : [esp32s3.cpu1] Target halted, PC=0x400568FC, debug_reason=00000000
Warn : No symbols for FreeRTOS!
Info : [esp32s3.cpu0] Target halted, PC=0x403B2482, debug_reason=00000001
Info : Flash mapping 0: 0x10020 -> 0x3c030020, 73 KB
Info : Flash mapping 1: 0x30020 -> 0x42000020, 179 KB
Info : [esp32s3.cpu0] Target halted, PC=0x403B2482, debug_reason=00000001Looks all good, the ESP32S3 was found on the JTAG connection. But there isn’t more output after the last
Info : [esp32s3.cpu0] Target halted, PC=0x403B2482, debug_reason=00000001
line and it won’t break at a breakpoint?
It sort of went into never-neverland.
this line in platformio.ini
debug_init_break = tbreak setup
is putting the breakpoint one line before void(setup() in my code.
I changed that and moved it down and now it appears to be working… I have to do more testing.
It seems I have to restart VSC and clean from time to time to get the debugger to work with larger projects. But I am progressing.
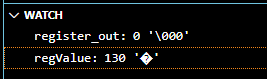
Now I am trying to see if a chip register is changing in the right way but trying to watch the variable I am using I just get "’ for the value of the variable.
    uint8_t register_out = adc1.getReadRegister(0x01);
    adc1.enableTemperatureSensor(false); // turn off temperature sensor
    register_out = adc1.getReadRegister(0x01);
With a breakpoint at any of these three lines, and register_out in the watch window, I only get
register_out: <optimized out>I had to move the declaration of register_out to the global space in order to be able to see the value in watch. Clearly I can’t move all my variables to the global space in order to view them. What is this and how do I deal with this? (Thank you)
Also get this in another place:
What does the ‘?’ in the dark diamond mean?
Then apply debug_build_flags so that no optimization is done (level 0).
debug_build_flags = -O0 -ggdb3 -g3