PlatformIO core: 4.3.4, Home 3.2.3
Target board D1 mini ESP32 (board = wemos_d1_mini32)
Debugger: Expressif ESP-PROG
Development computer: Window 10
Initially when I plugged the debugger into a usb port my pc would make a sound and it would show up in the Device Manager as a COM port. I was successfully able to debug a blink sketch. I had not connected the tx and rx wires so I was using a second usb plugged into my D1-mini-ESP32.
Then I did some more work on my project and then when I plugged the debugger in it didn’t show up in the Device Manager as a COM Port. I’m not sure if something happened to the esp-prog hardware or if I screwed up the device drivers on my PC.
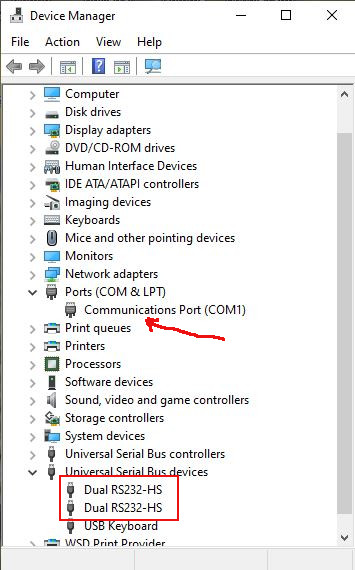
Note: COM1 is on my motherboard
Here is the PlatformIO log
========================= [SUCCESS] Took 3.72 seconds =========================
Reading symbols from d:\Data\ApplicationDev\ESP8266\PlatformIO\Projects\Blink\.pio\build\wemos_d1_mini32\firmware.elf...
done.
PlatformIO Unified Debugger -> http://bit.ly/pio-debug
PlatformIO: debug_tool = esp-prog
PlatformIO: Initializing remote target...
Open On-Chip Debugger  v0.10.0-esp32-20190708 (2019-07-08-11:04)
Licensed under GNU GPL v2
For bug reports, read
	http://openocd.org/doc/doxygen/bugs.html
none separate
adapter speed: 20000 kHz
Info : Configured 2 cores
esp32 interrupt mask on
Info : tcl server disabled
Info : telnet server disabled
Info : ftdi: if you experience problems at higher adapter clocks, try the command "ftdi_tdo_sample_edge falling"
Info : clock speed 20000 kHz
Info : JTAG tap: esp32.cpu0 tap/device found: 0x120034e5 (mfg: 0x272 (Tensilica), part: 0x2003, ver: 0x1)
Info : JTAG tap: esp32.cpu1 tap/device found: 0x120034e5 (mfg: 0x272 (Tensilica), part: 0x2003, ver: 0x1)
Info : esp32: Debug controller 0 was reset (pwrstat=0x5F, after clear 0x0F).
Info : esp32: Core 0 was reset (pwrstat=0x5F, after clear 0x0F).
Info : esp32: Debug controller 1 was reset (pwrstat=0x5F, after clear 0x0F).
Info : esp32: Core 1 was reset (pwrstat=0x5F, after clear 0x0F).
Info : Detected debug stubs @ 3ffc2718 on core0 of target 'esp32'
Info : accepting 'gdb' connection from pipe
Error: No symbols for FreeRTOS
Ignoring packet error, continuing...
warning: unrecognized item "timeout" in "qSupported" response
Ignoring packet error, continuing...
Ignoring packet error, continuing...
Ignoring packet error, continuing...
.pioinit:11: Error in sourced command file:
Bogus trace status reply from target: timeout
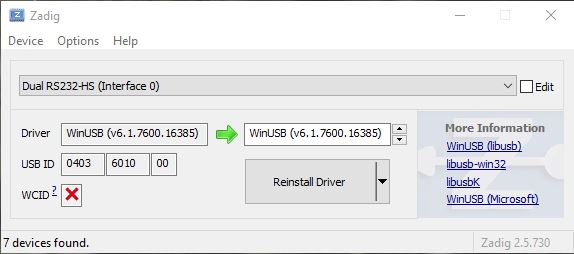
And, Zadig no longer shows the FDTI driver available for replacement. Is activating the FTDI drive just a onetime thing and after that the only choice is to update to the WinUSB? Is there a way to reinstall the FTDI? Interestingly in the device manager with only the ESP-Prog plugged in it shows two Dual RS232-HS devices but no COM port. Makes me think I’ve screwed something up with the device drivers.
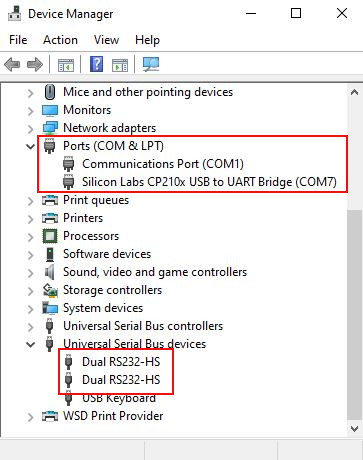
Here is a screen shot of the Device manager with both the target board and esp-prog plugged in using separate USB cables.
I think I’ve tried all of the obvious things including: trying a different USB cable, rebooting my PC. At one point I used the Device Manager to delete both of the Dual RS232-HS devise and the FTDI COM device and rebooted my PC, no change. I’ve rerun Zadig many times but the FTDI Bus drive never shows up again. I’ve tried reinstalling the driver but that hasn’t helped.
I realize this is probably not related to PlatformIO but there don’t seem to be many that understand configuring the ESP-Prog and @manuelbl seems to understand how all of this is supposed to work.
Thanks for your support and the GREAT PlatformIO IDE.