Esp-prog debugging on a Mac - no device found

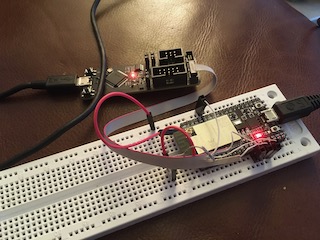
Im trying to get debugging going, this is my setup:
[env:esp32dev]

platform = espressif32

board = esp32dev

framework = espidf

monitor_speed = 115200

debug_tool = esp-prog

upload_protocol = esptool

#debug_init_break = tbreak setup

upload_port = /dev/cu.SLAB_USBtoUART

debug_port = /dev/cu.usbserial-14200

When I start the debugger, it compiles the code but doesn’t start debugging, the debug console has this.

========================= [SUCCESS] Took 25.52 seconds =========================

undefinedOpen On-Chip Debugger v0.10.0-esp32-20190708 (2019-07-08-11:04)

Licensed under GNU GPL v2

For bug reports, read

http://openocd.org/doc/doxygen/bugs.html

none separate

adapter speed: 20000 kHz

Info : Configured 2 cores

esp32 interrupt mask on

Info : Listening on port 6666 for tcl connections

Info : Listening on port 4444 for telnet connections

Error: no device found

Error: unable to open ftdi device with vid 0403, pid 6010, description ‘', serial '’ at bus location ‘*’

Warn : Flash driver of esp32.flash does not support free_driver_priv()

Warn : Flash driver of irom does not support free_driver_priv()

Warn : Flash driver of drom does not support free_driver_priv()

Any help would be appreciated … thanks

When esp-prog is your debug tool, there’s no need to declare the debug tool, this is a USB based search for the JTAG interface of the FTDI chip, not the serial port, so please remove that

Have you made sure to install libusb using brew?

Out of the box, macOS comes with drivers for FTDI chip. They will provide one or two serial ports for the ESP-Prog but at the same time block any other protocols.The drivers need to be unloaded.

Assuming you haven’t installed any FTDI drivers yourself and you are running macOS Catalina, the unload command is:

sudo kextunload /System/Library/DriverExtensions/DriverKit.AppleUSBFTDI.dext

If you have installed FTDI drivers, you have to unload them as well:

sudo kextunload /Library/Extensions/FTDIUSBSerialDriver.kext

The drivers will be back after the next reboot. You can also load them immediately with:

sudo kextload /System/Library/DriverExtensions/DriverKit.AppleUSBFTDI.dext

Most likely, that’s not a problem as the rather specific error message indicates that libusb is working.

Thanks for coming back both…really appreciated …

ive reinstalled LIBUSB using brew, reloaded the apple driver and removed debug_port from the config … now getting new errors :slight_smile:

new setup is :

[env:esp32dev]

platform = espressif32

board = esp32dev

framework = espidf

monitor_speed = 115200

debug_tool = esp-prog

upload_protocol = esptool

#debug_init_break = tbreak setup

upload_port = /dev/cu.SLAB_USBtoUART

#debug_port = /dev/cu.usbserial-142400

new errors are :
PlatformIO: Initializing remote target…
Open On-Chip Debugger v0.10.0-esp32-20190708 (2019-07-08-11:04)
Licensed under GNU GPL v2
For bug reports, read
OpenOCD: Bug Reporting
none separate
adapter speed: 20000 kHz
Info : Configured 2 cores
esp32 interrupt mask on
Info : tcl server disabled
Info : telnet server disabled
Info : ftdi: if you experience problems at higher adapter clocks, try the command “ftdi_tdo_sample_edge falling”
Info : clock speed 20000 kHz
Error: JTAG scan chain interrogation failed: all ones
Error: Check JTAG interface, timings, target power, etc.
Error: Trying to use configured scan chain anyway…
Error: esp32.cpu0: IR capture error; saw 0x1f not 0x01
Warn : Bypassing JTAG setup events due to errors
Info : accepting ‘gdb’ connection from pipe
Error: No symbols for FreeRTOS
Error: Target not examined yet

Error: Target not halted
Error: auto_probe failed
Error: Connect failed. Consider setting up a gdb-attach event for the target to prepare target for GDB connect, or use ‘gdb_memory_map disable’.
Error: attempted ‘gdb’ connection rejected
Ignoring packet error, continuing…
warning: unrecognized item “timeout” in “qSupported” response
Ignoring packet error, continuing…
.pioinit:11: Error in sourced command file:
Remote replied unexpectedly to ‘vMustReplyEmpty’: timeout

couple of other things ive noticed that im not sure are important… [1]when I upload the code it seems to be compiling in release mode…and when I start the debugger it recompiles in debug mode … although I dont think its reloading it…

[2] I cant upload the code when the debugger is attached unless I disconnect one of the pins …

Something is physically wrong with the connection, the line or the adapter configuration.

Overall there is progress. Initially, there was a communication problem between the Mac and the ESP-Prog. That’s now working. The problem is now in the communication between the ESP-Prog and the ESP32.

Regarding debug and release mode: That’s normal. That’s how PlatformIO works.

If you change the below line to platformio.ini, you can use ESP-Prog to upload code:

upload_protocol = esp-prog

Additionally, remove the upload_port entry.

Uploading is usually easier to get to work than debugging. But the next thing to check is certainly the wiring between ESP-Prog and ESP32 and possibly lowering the adapter speed as proposed by maxgerhardt.

hi , thanks again for coming back …

ive lowered the clock frequency and changed the ini file as advised… wiring is as follows …still problems im afraid… ini and output below.

  • GPIO12 — TDI
  • GPIO15 — TDO
  • GPIO13 — TCK
  • GPIO14 — TMS

GND also connected

ini contents :

[env:esp32dev]
platform = espressif32
board = esp32dev
framework = espidf
monitor_speed = 115200
debug_tool = esp-prog
upload_protocol = esp-prog
#debug_init_break = tbreak setup
#upload_port = /dev/cu.SLAB_USBtoUART
#debug_port = /dev/cu.usbserial-142400

output:

Open On-Chip Debugger v0.10.0-esp32-20190708 (2019-07-08-11:04)

Licensed under GNU GPL v2

For bug reports, read

http://openocd.org/doc/doxygen/bugs.html

none separate

adapter speed: 5000 kHz

Info : Configured 2 cores

esp32 interrupt mask on

Info : tcl server disabled

Info : telnet server disabled

Error: no device found

Error: unable to open ftdi device with vid 0403, pid 6010, description '*', serial '*' at bus location '*'

Warn : Flash driver of esp32.flash does not support free_driver_priv()

Warn : Flash driver of irom does not support free_driver_priv()

Warn : Flash driver of drom does not support free_driver_priv()

.pioinit:11: Error in sourced command file:

Remote connection closed

You’re back at the error where it doesn’t find the device. Have you used the kextunload and kextload commands?

hi,

Yes , I ran these earlier, ive just repeated … no change …

sudo kextunload /Library/Extensions/FTDIUSBSerialDriver.kext
cd /System/Library/DriverExtensions/
sudo kextload com.apple.DriverKit-AppleUSBFTDI.dext

also Ive not restarted osx … is this required ?

I rebooted, now getting this :slight_smile: Open On-Chip Debugger v0.10.0-esp32-20190708 (2019-07-08-11:04)

Licensed under GNU GPL v2

For bug reports, read

http://openocd.org/doc/doxygen/bugs.html

none separate

adapter speed: 5000 kHz

Info : Configured 2 cores

esp32 interrupt mask on

Info : tcl server disabled

Info : telnet server disabled

Info : clock speed 5000 kHz

Error: JTAG scan chain interrogation failed: all ones

Error: Check JTAG interface, timings, target power, etc.

Error: Trying to use configured scan chain anyway…

Error: esp32.cpu0: IR capture error; saw 0x1f not 0x01

Warn : Bypassing JTAG setup events due to errors

Info : accepting ‘gdb’ connection from pipe

Error: No symbols for FreeRTOS

Error: Target not examined yet

Error: Target not halted

Error: auto_probe failed

Error: Connect failed. Consider setting up a gdb-attach event for the target to prepare target for GDB connect, or use ‘gdb_memory_map disable’.

Error: attempted ‘gdb’ connection rejected

Ignoring packet error, continuing…

warning: unrecognized item “timeout” in “qSupported” response

Still a JTAG line is stuck at high. Try to go even below 5000kHz and double check every connection. Is the target powered separately? Is there anything else connected to the JTAG pins?

IMG_6048 (1)

Its currently powered from 2 separate usb leads …
Ive just disconnected the usb(s) and buzzed out each pin … the wiring connections seem fine. pin15 is connected under the chip. I dont have access to a logic analyser only a small hand held scope, is there anything else you can suggest I try ?

Uh that’s a weird looking esp-wroom-32 chip… with a uFL connector and on-board PCB? And larger? Could it be that you’re working with a ESP32-WROVER-B chip instead?

its ESP32-WROVER-IE …is this not compatible with the setup… its listed as esp32-prog compatible … hope ive not been waiting you’re time …

Try changing your board setting to board = esp-wrover-kit, as this is the only PlatformIO supported board which uses the esp-wrover.cfg config (ref). Your previous choice of esp32dev dictates the openocd conffig for a wroom-32 chip.

Then change the adapter khz in the esp32-wrover.cfg to something like 1000kHz or even 500kHz (like in the originally linked post). 5MHz on a breadboard seems unstable to me.

hi… still got problems im afraid …

Retrieving maximum program size .pio/build/esp-wrover-kit/firmware.elf
Checking size .pio/build/esp-wrover-kit/firmware.elf
Advanced Memory Usage is available via “PlatformIO Home > Project Inspect”
RAM: [ ] 3.8% (used 12564 bytes from 327680 bytes)
Flash: [= ] 14.1% (used 147913 bytes from 1048576 bytes)
========================= [SUCCESS] Took 31.44 seconds =========================
Reading symbols from /Users/franklynch/Documents/PlatformIO/Projects/testEspDev/.pio/build/esp-wrover-kit/firmware.elf…
done.
PlatformIO Unified Debugger → Redirecting...
PlatformIO: debug_tool = esp-prog
PlatformIO: Initializing remote target…
Open On-Chip Debugger v0.10.0-esp32-20190708 (2019-07-08-11:04)
Licensed under GNU GPL v2
For bug reports, read
OpenOCD: Bug Reporting
none separate
adapter speed: 500 kHz
Info : Configured 2 cores
esp32 interrupt mask on
Info : tcl server disabled
Info : telnet server disabled
Error: no device found
Error: unable to open ftdi device with vid 0403, pid 6010, description ‘', serial '’ at bus location ‘*’

Warn : Flash driver of esp32.flash does not support free_driver_priv()
Warn : Flash driver of irom does not support free_driver_priv()
Warn : Flash driver of drom does not support free_driver_priv()
.pioinit:11: Error in sourced command file:
Remote connection closed

ignore last response … power was disconnected

still problems if afraid …

Reading symbols from /Users/franklynch/Documents/PlatformIO/Projects/testEspDev/.pio/build/esp-wrover-kit/firmware.elf…

done.

PlatformIO Unified Debugger → Redirecting...

PlatformIO: debug_tool = esp-prog

PlatformIO: Initializing remote target…

Open On-Chip Debugger v0.10.0-esp32-20190708 (2019-07-08-11:04)

Licensed under GNU GPL v2

For bug reports, read

http://openocd.org/doc/doxygen/bugs.html

none separate

adapter speed: 500 kHz

Info : Configured 2 cores

esp32 interrupt mask on

Info : tcl server disabled

Info : telnet server disabled

Info : clock speed 500 kHz

Error: JTAG scan chain interrogation failed: all ones

Error: Check JTAG interface, timings, target power, etc.

Error: Trying to use configured scan chain anyway…

Error: esp32.cpu0: IR capture error; saw 0x1f not 0x01

Warn : Bypassing JTAG setup events due to errors

Info : accepting ‘gdb’ connection from pipe

Error: No symbols for FreeRTOS

Error: Target not examined yet

Error: Target not halted

Error: auto_probe failed

Error: Connect failed. Consider setting up a gdb-attach event for the target to prepare target for GDB connect, or use ‘gdb_memory_map disable’.

Error: attempted ‘gdb’ connection rejected

Ignoring packet error, continuing…

warning: unrecognized item “timeout” in “qSupported” response

do you think it would help if I removed it from the breadboard and connected using female Dupont connectors straight onto the board?