Hello .
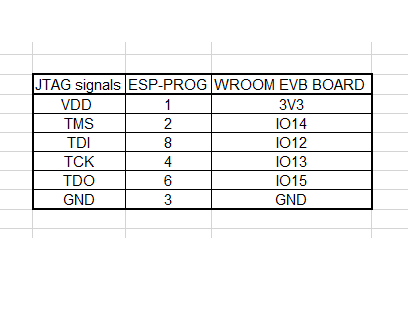
My hardware : debug (JTAG) esp32 wroom-doit-kit using esp-prog.
It all worked pretty well , until it (debug) stoped working.
log from debug console:
Processing esp32doit-devkit-v1 (platform: espressif32; board: esp32dev; framework: espidf)
--------------------------------------------------------------------------------
Verbose mode can be enabled via `-v, --verbose` option
CONFIGURATION: https://docs.platformio.org/page/boards/espressif32/esp32dev.html
PLATFORM: Espressif 32 1.11.1 > Espressif ESP32 Dev Module
HARDWARE: ESP32 240MHz, 320KB RAM, 4MB Flash
DEBUG: Current (esp-prog) External (esp-prog, iot-bus-jtag, jlink, minimodule, olimex-arm-usb-ocd, olimex-arm-usb-ocd-h, olimex-arm-usb-tiny-h, olimex-jtag-tiny, tumpa)
PACKAGES: toolchain-xtensa32 2.50200.80 (5.2.0), framework-espidf 3.30300.190916 (3.3.0), tool-esptoolpy 1.20600.0 (2.6.0)
LDF: Library Dependency Finder -> http://bit.ly/configure-pio-ldf
LDF Modes: Finder ~ chain, Compatibility ~ soft
Found 0 compatible libraries
Scanning dependencies...
No dependencies
Building in debug mode
Retrieving maximum program size .pio\build\esp32doit-devkit-v1\firmware.elf
Checking size .pio\build\esp32doit-devkit-v1\firmware.elf
Advanced Memory Usage is available via "PlatformIO Home > Project Inspect"
DATA:    [          ]   3.8% (used 12400 bytes from 327680 bytes)
PROGRAM: [==        ]  21.3% (used 223652 bytes from 1048576 bytes)
========================= [SUCCESS] Took 22.30 seconds =========================
Reading symbols from c:\Users\moran\Documents\PlatformIO\Projects\uDiscrete-2\.pio\build\esp32doit-devkit-v1\firmware.elf...
done.
PlatformIO Unified Debugger -> http://bit.ly/pio-debug
PlatformIO: debug_tool = esp-prog
PlatformIO: Initializing remote target...
Open On-Chip Debugger  v0.10.0-esp32-20190708 (2019-07-08-11:04)
Licensed under GNU GPL v2
For bug reports, read
	http://openocd.org/doc/doxygen/bugs.html
none separate
adapter speed: 20000 kHz
Info : Configured 2 cores
esp32 interrupt mask on
Info : tcl server disabled
Info : telnet server disabled
Info : ftdi: if you experience problems at higher adapter clocks, try the command "ftdi_tdo_sample_edge falling"
Info : clock speed 20000 kHz
Error: JTAG scan chain interrogation failed: all ones
Error: Check JTAG interface, timings, target power, etc.
Error: Trying to use configured scan chain anyway...
Error: esp32.cpu0: IR capture error; saw 0x1f not 0x01
Warn : Bypassing JTAG setup events due to errors
Info : accepting 'gdb' connection from pipe
Error: No symbols for FreeRTOS
Error: Target not examined yet


Error: Target not halted
Error: auto_probe failed
Error: Connect failed. Consider setting up a gdb-attach event for the target to prepare target for GDB connect, or use 'gdb_memory_map disable'.
Error: attempted 'gdb' connection rejected
Error: error during select: Unknown error
Warn : Flash driver of esp32.flash does not support free_driver_priv()
Warn : Flash driver of irom does not support free_driver_priv()
Warn : Flash driver of drom does not support free_driver_priv()
.pioinit:15: Error in sourced command file:
Remote communication error.  Target disconnected.: No error.
I’ve also tried to update
pio update
get :
no debug adapter
Please advise.
Thanks in advance’
Moran.