A brief introduction to the semihosting mechanism and configuration steps for PlatformIO projects.
1 Like
Hey @valeros, I am trying to get this working, with the purpose of having coverage files written on the host when doing unit tests on the target.
I followed your blogpost and took the code from the example on github.
As my project is C++, I needed a small modification in adding extern “C” to initialise_monitor_handles(void) forward declaration.
I can build the application / test, but I cannot get it to start in the debugger. After a few seconds of activity, everything stops and the debugger is not launched.
Do you have any hints / ideas or time to help me out with this ?
One more thing: I had to remove syscalls.c because it causes double declarations with some of the semihosting code.
Hi @strooom
Do you have any hints / ideas or time to help me out with this ?
What hardware are you using? What happens if you launch a debug session in the CLI mode using the following command directly in the IDE terminal?
pio debug --interface=gdb -- -x .pioinit
I had to remove syscalls.c because it causes double declarations with some of the semihosting code.
There is no syscalls.c in the tutorial, so I’m not sure where it comes from.
The hardware is a custom board, with STM32WLE5 on it. (in fact it’s Seeed Lora-E5 module, which has the STM32WLE5 inside). I created a custom board def for it, as well as needed to do some manual setup of the STM32WLXX HAL as it is not yet part of standard PlatformIO distribution.
I use an STLINK-V3MINIE as debug probe, using SWD/SWO
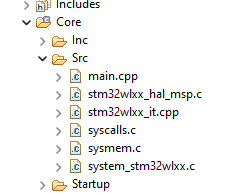
The syscalls.c is a file generated by STM32CubeMx where I did the original setup of the project. Below is screenshot of the Src folder generated by STM32CubeMx
In the PlatformIO project, I put some of these files into a lib/cube folder, as they are needed for each test-application as well, and I did not want to copy them to each test_application folder.
So far I am able to build, debug, unit test (host and target) and debug unit tests (host and target), which is already very good. I am using one of the UARTs as test-port.
The whole repo is public at : Strooom/MuMo-v2-Node-SW: Firmware for the Museum Monitor V2 node (github.com). Look into the develop branch.
I will now do some tests with gdb in CLI mode, to see what is going wrong when launching the debugger. More info soon.
1 Like
Hi, I was able to launch the debugger manually, which revealed the errors.
(Needed to add the -e <environment> as I have many and without it selected the first one in the list).
Turned out it was a problem with the hardware:
Info : Target voltage: 0.008005
Error: target voltage may be too low for reliable debugging
I was using a USB/UART to collect test results, and this was powering the hardware. But with semihosting I disconnected the USB/UART, as I want to collect the test results via the debug-interface. With the USB removed, the board should run on the battery, but unfortunately, the battery seems dead…
When properly powering the board, the debugger also started correctly, and the unit test results are collected in the debug console.
So far so good. Next step is to collect the coverage files from the target.
Many thanks for your help @valeros !
Ok, some progress update here :
I tested semihosting and I can let the target write files on the host.
Now I’ve enabled the build-flags for collecting code coverage:
-lgcov
-ftest-coverage
-fprofile-arcs
but when I start the build/debug I get a nasty error on insufficient RAM…
... ld.exe: .pio\build\semi\firmware.elf section `.data' will not fit in region `RAM1'
... ld.exe: region `RAM1' overflowed by 84792 bytes
I only have 64K of RAM, so unless I can instruct gcov to use less RAM, I’m out of luck here.
I’m afraid there is no easy workaround except to use an MCU with larger RAM size.
Yes, it started to dawn on me ![]()
Anyway, it was a useful exercise, and being able to write files from a target to a host will prove to be a timesaver for several applications.
On-target code coverage may be better generated by CPU execution tracers, such as a JTrace. These are very expensive though. Or something like this.
On desktop this is much easier.
Yesterday I read the docs on Build Middlewares (Build Middlewares — PlatformIO latest documentation) and I decided to try this technique to try to add coverage build flags to selected source files only, hoping that this would require less RAM memory.
- so I removed the build-flags for coverage from platformio.ini
- I added a pre:custom script which adds the flags only to selected files using
return env.Object(
        node,
        CPPDEFINES=env["CPPDEFINES"],
        CCFLAGS=env["CCFLAGS"] + ["-lgcov"] + ["--coverage"] + ["-fprofile-arcs"] + ["-ftest-coverage"],
    )
I also needed to add some flags for the linker
env.Append(
  LINKFLAGS=[
      "-lgcov",
      "--coverage"
  ]
)
Now the debug build works, fits in the 64K RAM, a .gcno file appears in the build directory, the debugger starts. When I let it run to completion, I don’t yet see a .gcda file being written though…
… to be continues …
1 Like
Hi there! Just decided to try semihosting, but I can’t get it to work with cpp file. If I build the example with .c file, it does work. Any tips?!
Import("env")

env.Append(
    # Use the semihosted version of the syscalls
    LINKFLAGS=[
        "--specs=rdimon.specs"
    ],
    LIBS=[
        "rdimon",
    ],
)
[env:bluepill_f103c8]
platform = ststm32
board = bluepill_f103c8
framework = arduino
upload_protocol = stlink

upload_flags = -c set CPUTAPID 0            ; Allow Original and Clone STM32 to be detected by OpenOCD debugger.
debug_build_flags = -O0 -ggdb3              ; Apply no optimization to the code written.

build_unflags =
    --specs=nosys.specs
    -lnosys

extra_scripts = extra_script.py              ; The "extra_script.py" file must be located in the main project folder

debug_extra_cmds =
    monitor arm semihosting enable
    monitor arm semihosting_fileio enable

test_testing_command =
    ${platformio.packages_dir}/tool-openocd/bin/openocd
    -s
    ${platformio.packages_dir}/tool-openocd
    -f
    openocd/scripts/board/stlink.cfg
    -c
    init
    -c
    arm semihosting enable
    -c
    reset run
#include <Arduino.h>


#define ledPin PC13

extern "C" void initialise_monitor_handles(void);

void setup()
{
  initialise_monitor_handles();   /* This Function MUST come before the first printf() */
  printf("Hello world!\n");
}

void loop() {
  digitalWrite(ledPin, HIGH);
  delay(300);
  digitalWrite(ledPin, LOW);
  delay(300);
  printf("Hello World!\n");
}
The problem is that the Arduino core implements the _write() syscall so that by default printf() goes to the Serial.
If you remove the _write() implementation of the core, it prints it as expected
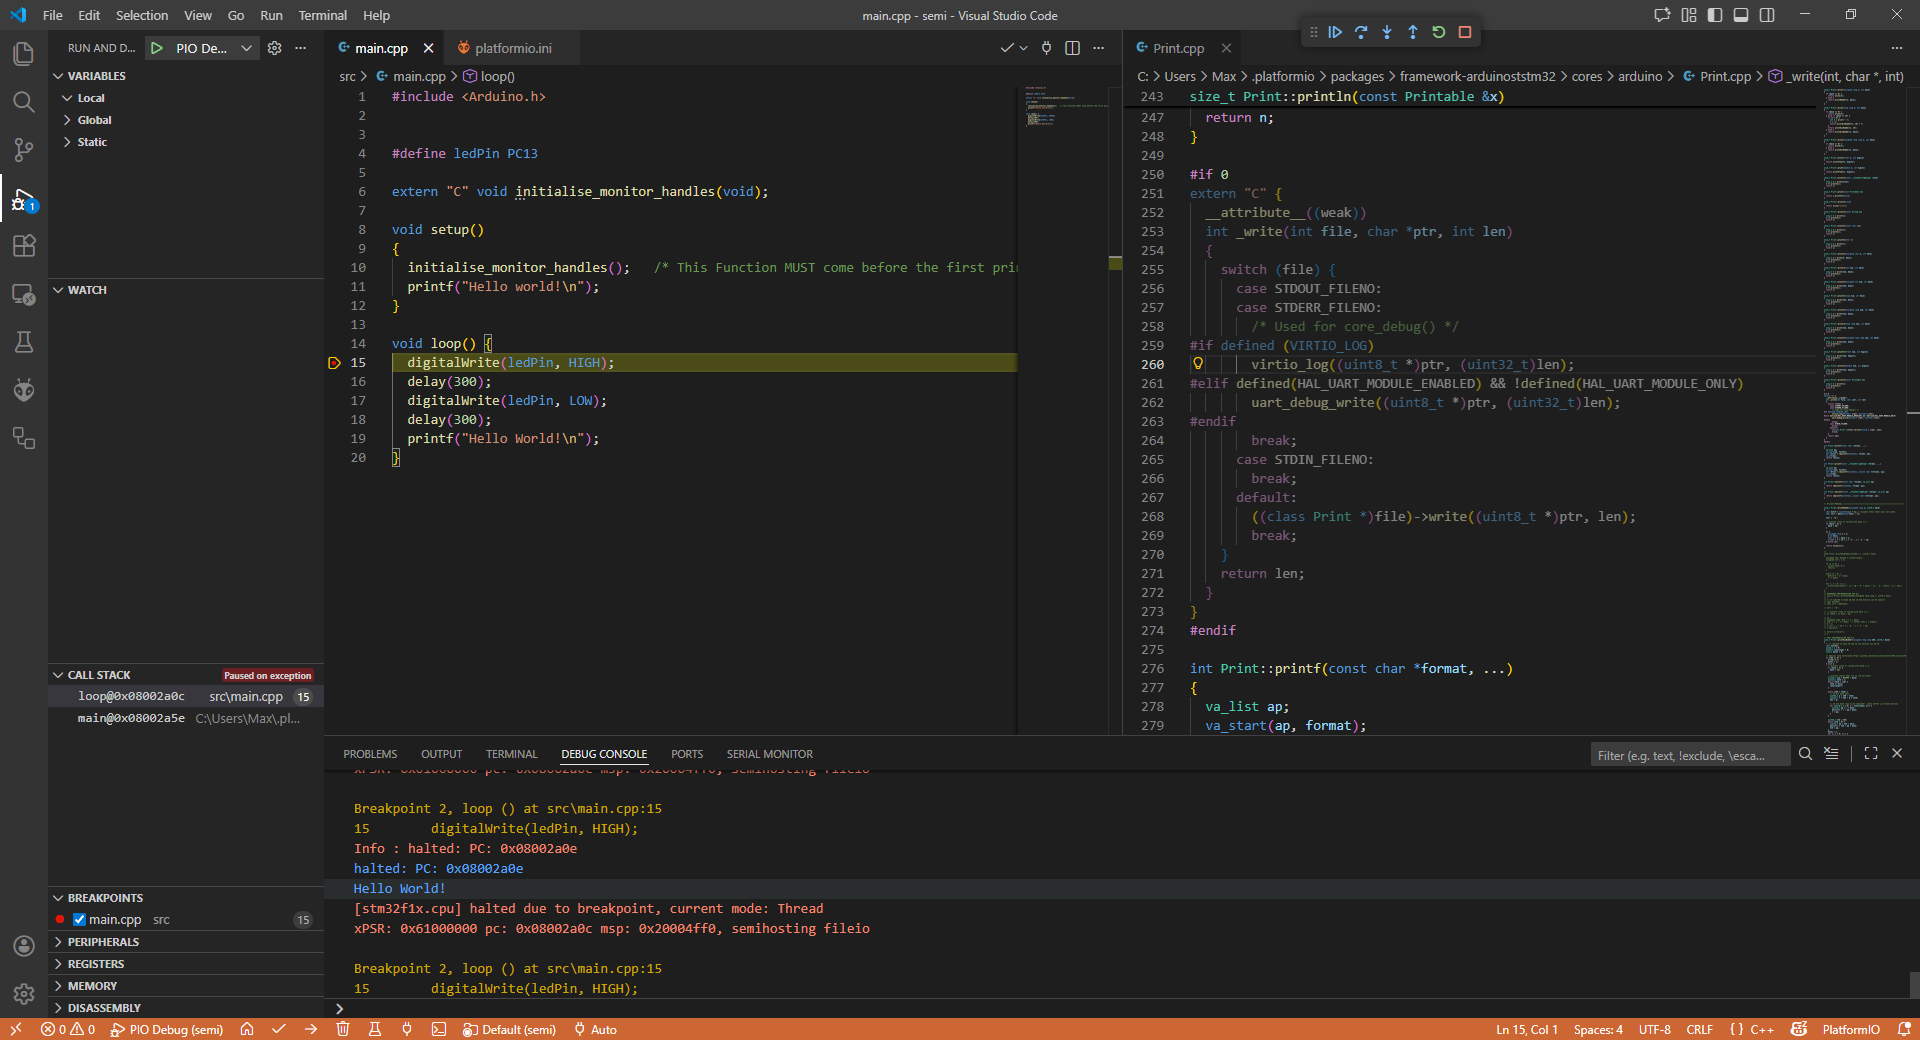
Maybe it’s because of the linking order of the libraries why the _write implementation from --specs=rdimon.specs is not taken or overwriting the weak implementation of the core..
1 Like
You can link it a bit differently and force every symbol of the librdimon library to be used unconditionally (over the symbols defined by Arduino, the whole archive), like this.
Import("env")

env.Append(
    # Use the semihosted version of the syscalls
    LINKFLAGS=[
        "-Wl,--whole-archive",
        "-lrdimon_nano",
        "-Wl,--no-whole-archive"
    ],
)
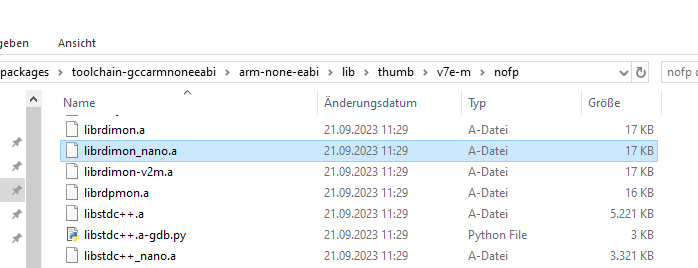
Note that since the Arduino firmware builds with --specs=nano.specs you also need the nano version of librdimon: There’s two.
Then it works without modifying any Arduino core files.

2 Likes
Incredible! Thank you. I would never figure it out.
Do you mind if I create a repo with this?
Of course, feel free to create a repository with that code.