Hi, I have connected an ESP32 wroom module with its own SiliconLabs USB serial support on board to a FT232R based USB FTDI adaptor and can happily compile code to the com port the ESP32 is on and all runs fine, I then decided to take advantage of the now free (THANK YOU WESTERN DIGITAL, love you) unified debugger and set up a FT232R.cfg in the same folder as my projects platformio.ini and it looks as the following
interface ft232r

ft232r_vid_pid 0x0403 0x6001
as per the instructions in this [Debugger with FTDI C232] post only changing the device from the C232 to the FT232 (I know the FT232 is slower but OpenOCD fully supports it) the instructions also say to create a custom debug server environment with the following in platformio.ini
However, when I come to enter debug mode all seems to progress fine until it looks for the debugger and then it seems to totally ignore the FT232R.cfg and goes looking for a device with a VID/PID of 403:6010 which is an FTDI 2232 mini module chip, what am I doing wrong?
yea, just did some messing about and it seems the cfg is not read unless I restart mscode, otherwise i can put fubar in the text and it does not detect it until I restart mscode again, anyways, it is now doing this, so a step forward at least, anything spring out obvious from that lot?
Warn : Bypassing JTAG setup events due to errors
Info : accepting 'gdb' connection from pipe
Error: No symbols for FreeRTOS
Error: Target not examined yet


Error: Target not halted
Error: auto_probe failed
Error: Connect failed. Consider setting up a gdb-attach event for the target to prepare target for GDB connect, or use 'gdb_memory_map disable'.
Error: attempted 'gdb' connection rejected
Error: error during select: Unknown error
Warn : Flash driver of esp32.flash does not support free_driver_priv()
Warn : Flash driver of irom does not support free_driver_priv()
Warn : Flash driver of drom does not support free_driver_priv()
.pioinit:10: Error in sourced command file:
Remote communication error.  Target disconnected.: No error.
Reading symbols from c:/Users/spenc/Documents/PlatformIO/Projects/debugtest/.pioenvs/esp32dev/firmware.elf...

done.

PlatformIO Unified Debugger > http://bit.ly/pio-debug

PlatformIO: Initializing remote target...

Open On-Chip Debugger v0.10.0-esp32-20190313 (2019-03-13-09:57)

Licensed under GNU GPL v2

For bug reports, read

http://openocd.org/doc/doxygen/bugs.html

Info : only one transport option; autoselect 'jtag'

Warn : Transport "jtag" was already selected

adapter speed: 20000 kHz

Info : Configured 2 cores

esp32 interrupt mask on

Info : tcl server disabled

Info : telnet server disabled

Info : clock speed 3000 kHz
Error: JTAG scan chain interrogation failed: all ones
Error: Check JTAG interface, timings, target power, etc.
Error: Trying to use configured scan chain anyway...
Error: esp32.cpu0: IR capture error; saw 0x1f not 0x01
Warn : Bypassing JTAG setup events due to errors
Info : accepting 'gdb' connection from pipe
Error: No symbols for FreeRTOS
Error: Target not examined yet
There might be plenty of reasons why the debug session doesn’t start. I see you’re using Windows, so have you updated drivers for ftdi probe? Are you sure that the wiring between your board and the debug probe is correct? Is there any program running on the MCU at the moment that uses one of JTAG pins?
Here is the debug console output from the latest , much better but still unworking test, almost there by the looks.
platformio.ini is
; PlatformIO Project Configuration File
;
;   Build options: build flags, source filter
;   Upload options: custom upload port, speed and extra flags
;   Library options: dependencies, extra library storages
;   Advanced options: extra scripting
;
; Please visit documentation for the other options and examples
; https://docs.platformio.org/page/projectconf.html

[env:esp32dev]
platform = espressif32
framework = arduino
board = esp32dev
monitor_speed= 115200
debug_server =
  $PLATFORMIO_HOME_DIR/packages/tool-openocd-esp32/bin/openocd
  -s
  $PLATFORMIO_HOME_DIR/packages/tool-openocd-esp32/share/openocd/scripts
  -f
  $PROJECT_DIR/FT232R.cfg
  -f
  board/esp-wroom-32.cfg
debug_tool = custom
debug_init_break = tbreak setup
FT232R.cfg is
interface ft232r

ft232r_vid_pid 0x403 0x6001
main.cpp is
#include <Arduino.h>
#define GREENLED 2
void setup()
{
  // put your setup code here, to run once:
  Serial.begin(115200);
  Serial.println("Hello World");
  pinMode(GREENLED, OUTPUT);
}

void loop()
{
  // put your main code here, to run repeatedly:
  digitalWrite(GREENLED, LOW);
  Serial.println("led off");
  delay(2000);
  digitalWrite(GREENLED, HIGH);
  Serial.println("led on");
  delay(2000);
}
Debug Console is
Reading symbols from c:/Users/spenc/Documents/PlatformIO/Projects/debugtest/.pioenvs/esp32dev/firmware.elf...
done.
PlatformIO Unified Debugger > http://bit.ly/pio-debug
PlatformIO: Initializing remote target...
Open On-Chip Debugger v0.10.0-esp32-20190313 (2019-03-13-09:57)
Licensed under GNU GPL v2
For bug reports, read
http://openocd.org/doc/doxygen/bugs.html
Info : only one transport option; autoselect 'jtag'
Warn : Transport "jtag" was already selected
adapter speed: 20000 kHz
Info : Configured 2 cores
esp32 interrupt mask on
Info : tcl server disabled
Info : telnet server disabled
Info : clock speed 3000 kHz
Info : JTAG tap: esp32.cpu0 tap/device found: 0x120034e5 (mfg: 0x272 (Tensilica), part: 0x2003, ver: 0x1)
Info : JTAG tap: esp32.cpu1 tap/device found: 0x120034e5 (mfg: 0x272 (Tensilica), part: 0x2003, ver: 0x1)
Info : esp32: Debug controller 0 was reset (pwrstat=0x5F, after clear 0x0F).
Info : esp32: Core 0 was reset (pwrstat=0x5F, after clear 0x0F).
Info : esp32: Debug controller 1 was reset (pwrstat=0x5F, after clear 0x0F).
Info : esp32: Core 1 was reset (pwrstat=0x5F, after clear 0x0F).
Info : Detected debug stubs @ 3ffc0c18 on core0 of target 'esp32'
Info : accepting 'gdb' connection from pipe
Error: No symbols for FreeRTOS
Info : Target halted. PRO_CPU: PC=0x400E917E (active) APP_CPU: PC=0x00000000
Info : esp32: Debug controller 0 was reset (pwrstat=0x5F, after clear 0x0F).
Info : esp32: Core 0 was reset (pwrstat=0x5F, after clear 0x0F).
Info : esp32: Debug controller 1 was reset (pwrstat=0x5F, after clear 0x0F).
Info : esp32: Core 1 was reset (pwrstat=0x5F, after clear 0x0F).
Ignoring packet error, continuing...
warning: unrecognized item "timeout" in "qSupported" response
Error: timed out while waiting for target halted / 4 - 2
Info : Target halted. PRO_CPU: PC=0x400E917E (active) APP_CPU: PC=0x00000000
Info : Detected debug stubs @ 3ffc0c18 on core0 of target 'esp32'
Error: xtensa_wait_algorithm: not halted 0, pc 0x400e917e, ps 0x60120
Error: Failed to wait algorithm (-302)!
Error: Algorithm run failed (-302)!
Error: Failed to run flasher stub (-302)!
Warn : Failed to get flash mappings (-302)!
Ignoring packet error, continuing...
Error: Target is already running an algorithm
Error: Failed to start algorithm (-4)!
Error: Algorithm run failed (-4)!
Error: Failed to run flasher stub (-4)!.
Error: Target is already running an algorithm
Error: Failed to start algorithm (-4)!
Error: Algorithm run failed (-4)!
Error: Failed to run flasher stub (-4)!.
Error: Failed to probe flash, size 0 KB
Error: auto_probe failed
Error: Connect failed. Consider setting u a gdb-attach event for the target to prepare target for GDB connect, or use 'gdb_memory_map disable'.
Error: attempted 'gdb' connection rejected
Error: error during select: Unknown error
Info : Restore debug stubs @ 3ffc0c18 on core0 of target 'esp32'
Warn : Flash driver of esp32.flash does not support free_driver_priv()
Warn : Flash driver of irom does not support free_driver_priv()
Warn : Flash driver of drom does not support free_driver_priv()
.pioinit:10: Error in sourced command file:
Remote communication error. Target disconnected.: No error.
This line seems strange: Error: No symbols for FreeRTOS
Does the blink example work at all when you upload it? And what is your hardware setup? Is it a custom board? Another option is to try different initialization commands. Also it would be a worthwhile idea to try another debug probe, as it seems to me that there is some kind of communication problem between openocd and your debug probe.
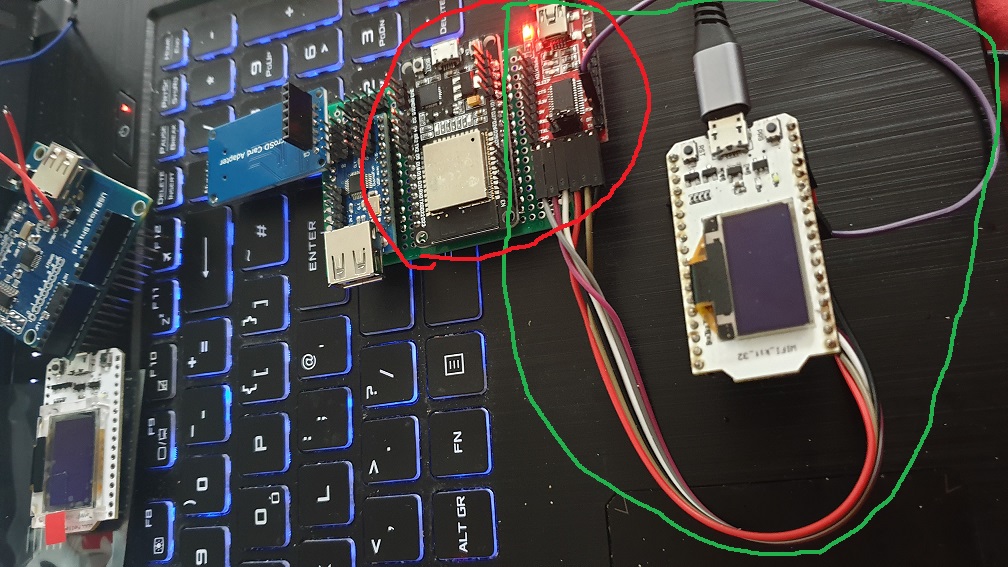
Okie dokie, thanks for that, I’ll try a different FTDI FT232RL board (if I can find one) As to the set up, I have various ESP32’s from HELTEK to some WROOM modules mounted on there own coms boards ala [Amazon.co.uk] they are then wired as either red or green circle (not exactly high speed data friendly)
> Executing task in folder debugtest: C:\Users\spenc\.platformio\penv\Scripts\platformio.exe run <

Processing esp32dev (framework: arduino; platform: espressif32; board: esp32dev)
-------------------------------------------------------------------------------------------------------------------------------------------------------------------------------------------------------------------------
Verbose mode can be enabled via `-v, --verbose` option
CONFIGURATION: https://docs.platformio.org/page/boards/espressif32/esp32dev.html
PLATFORM: Espressif 32 > Espressif ESP32 Dev Module
HARDWARE: ESP32 240MHz 320KB RAM (4MB Flash)
DEBUG: CURRENT(custom) EXTERNAL(esp-prog, iot-bus-jtag, jlink, minimodule, olimex-arm-usb-ocd, olimex-arm-usb-ocd-h, olimex-arm-usb-tiny-h, olimex-jtag-tiny, tumpa)
Library Dependency Finder -> http://bit.ly/configure-pio-ldf
LDF MODES: FINDER(chain) COMPATIBILITY(soft)
Collected 26 compatible libraries
Scanning dependencies...
No dependencies
Compiling .pioenvs\esp32dev\src\main.cpp.o
Compiling .pioenvs\esp32dev\FrameworkArduino\Esp.cpp.o
Compiling .pioenvs\esp32dev\FrameworkArduino\FunctionalInterrupt.cpp.o
Compiling .pioenvs\esp32dev\FrameworkArduino\HardwareSerial.cpp.o
Compiling .pioenvs\esp32dev\FrameworkArduino\IPAddress.cpp.o
Compiling .pioenvs\esp32dev\FrameworkArduino\IPv6Address.cpp.o
Compiling .pioenvs\esp32dev\FrameworkArduino\MD5Builder.cpp.o
Compiling .pioenvs\esp32dev\FrameworkArduino\Print.cpp.o
Compiling .pioenvs\esp32dev\FrameworkArduino\Stream.cpp.o
Compiling .pioenvs\esp32dev\FrameworkArduino\StreamString.cpp.o
Compiling .pioenvs\esp32dev\FrameworkArduino\WMath.cpp.o
Compiling .pioenvs\esp32dev\FrameworkArduino\WString.cpp.o
Compiling .pioenvs\esp32dev\FrameworkArduino\base64.cpp.o
Compiling .pioenvs\esp32dev\FrameworkArduino\cbuf.cpp.o
Compiling .pioenvs\esp32dev\FrameworkArduino\esp32-hal-adc.c.o
Compiling .pioenvs\esp32dev\FrameworkArduino\esp32-hal-bt.c.o
Compiling .pioenvs\esp32dev\FrameworkArduino\esp32-hal-cpu.c.o
Compiling .pioenvs\esp32dev\FrameworkArduino\esp32-hal-dac.c.o
Compiling .pioenvs\esp32dev\FrameworkArduino\esp32-hal-gpio.c.o
Compiling .pioenvs\esp32dev\FrameworkArduino\esp32-hal-i2c.c.o
Compiling .pioenvs\esp32dev\FrameworkArduino\esp32-hal-ledc.c.o
Compiling .pioenvs\esp32dev\FrameworkArduino\esp32-hal-matrix.c.o
Compiling .pioenvs\esp32dev\FrameworkArduino\esp32-hal-misc.c.o
Compiling .pioenvs\esp32dev\FrameworkArduino\esp32-hal-psram.c.o
Compiling .pioenvs\esp32dev\FrameworkArduino\esp32-hal-rmt.c.o
C:\Users\spenc\.platformio\packages\framework-arduinoespressif32\cores\esp32\esp32-hal-i2c.c: In function 'i2cProcQueue':
C:\Users\spenc\.platformio\packages\framework-arduinoespressif32\cores\esp32\esp32-hal-i2c.c:1282:18: warning: unused variable 'tAfter' [-Wunused-variable]
portTickType tAfter=xTaskGetTickCount();
^
C:\Users\spenc\.platformio\packages\framework-arduinoespressif32\cores\esp32\esp32-hal-i2c.c:1274:18: warning: unused variable 'tBefore' [-Wunused-variable]
Compiling .pioenvs\esp32dev\FrameworkArduino\esp32-hal-sigmadelta.c.o
portTickType tBefore=xTaskGetTickCount();
^
Compiling .pioenvs\esp32dev\FrameworkArduino\esp32-hal-spi.c.o
Compiling .pioenvs\esp32dev\FrameworkArduino\esp32-hal-time.c.o
Compiling .pioenvs\esp32dev\FrameworkArduino\esp32-hal-timer.c.o
Compiling .pioenvs\esp32dev\FrameworkArduino\esp32-hal-touch.c.o
Compiling .pioenvs\esp32dev\FrameworkArduino\esp32-hal-uart.c.o
Compiling .pioenvs\esp32dev\FrameworkArduino\libb64\cdecode.c.o
Compiling .pioenvs\esp32dev\FrameworkArduino\libb64\cencode.c.o
Compiling .pioenvs\esp32dev\FrameworkArduino\main.cpp.o
Compiling .pioenvs\esp32dev\FrameworkArduino\stdlib_noniso.c.o
Compiling .pioenvs\esp32dev\FrameworkArduino\wiring_pulse.c.o
Compiling .pioenvs\esp32dev\FrameworkArduino\wiring_shift.c.o
Archiving .pioenvs\esp32dev\libFrameworkArduino.a
Linking .pioenvs\esp32dev\firmware.elf
Building .pioenvs\esp32dev\firmware.bin
Retrieving maximum program size .pioenvs\esp32dev\firmware.elf
Checking size .pioenvs\esp32dev\firmware.elf
Memory Usage -> http://bit.ly/pio-memory-usage
DATA:    [          ]   4.1% (used 13540 bytes from 327680 bytes)
PROGRAM: [==        ]  15.5% (used 203224 bytes from 1310720 bytes)
esptool.py v2.6
============================================================================================== [SUCCESS] Took 7.84 seconds ==============================================================================================

Terminal will be reused by tasks, press any key to close i
I don’t know how to try different initialization methods however so not sure what to do there, I did notice the debugger does not attempt to upload the debug enabled code after building it, so not sure if that is causing any issues.
I have an FT2232H mini module arriving tomorrow so I will have a way to debug hopefully with that, but getting the FT232R chip to work would be extremely useful for users on lower budgets. Thanks again.