Debugging starts but it doesn't work properly

Hello dear platformio users,
Before I raise my issue, let me show you my platform.ini file

platform = espressif32
board = esp32doit-devkit-v1
framework = arduino
monitor_speed = 115200
debug_init_break = tbreak setup
debug_tool = esp-prog
upload_port = COM14
upload_protocol = esp-prog

When I start Debug without any problems (rarely :frowning: ), the debug cursor stops at the breakpoint where I want, but when I press the resume button, I can’t read any value and the debug process doesn’t happen. That’s my first issue.

Here is second issue; When i start debug process, debug console says that:

Info : [esp32.cpu1] Target halted, PC=0x40000400, debug_reason=00000000
[esp32.cpu1] Target halted, PC=0x40000400, debug_reason=00000000
Temporary breakpoint 1 at 0x400d131b: file src/main.cpp, line 118.
PlatformIO: Initialization completed
PlatformIO: Resume the execution to `debug_init_break = tbreak setup`
PlatformIO: More configuration options -> https://bit.ly/pio-debug
Note: automatically using hardware breakpoints for read-only addresses.

The debug cursor (yellow one) is nowhere to be seen and the pause button becomes active when there should be a resume button. (As if the debug process has started and I pressed the resume button)

I’m waiting for your help, thanks!

Then turn the temprary break (which is halt and then immediately continue) into a hard break.

1 Like

Thanks for your reply. How can i do that? Can u explain please?

You locate the text

debug_init_break = tbreak setup

in your platformio.ini and change it to

debug_init_break = break setup
1 Like

Thank you for advice but the result is still same.

Here you can see Debug Console.

Info : [esp32.cpu1] Target halted, PC=0x40000400, debug_reason=00000000
[esp32.cpu1] Target halted, PC=0x40000400, debug_reason=00000000
Breakpoint 1 at 0x400d131b: file src/main.cpp, line 118.
PlatformIO: Initialization completed
PlatformIO: Resume the execution to `debug_init_break = break setup`
PlatformIO: More configuration options -> https://bit.ly/pio-debug
Note: automatically using hardware breakpoints for read-only addresses.

And here you can see that there is no debug cursor that should be in the setup section.

In addition, after the Debug preparation is finished, the resume button should be ready to be pressed, but the pause button is active as if the resume button was pressed.

ss1

Thanks for quick replies!

When you press the pause button, what is the call stack / backtrace?

1 Like

I think this is your answer.

1 Like

Create a new project but with only the blink code: platform-espressif32/examples/arduino-blink at develop ¡ platformio/platform-espressif32 ¡ GitHub

Does debugging work there?

1 Like

It works fine with Blink. After the Blink project, I tried My project again and didn’t work again.

Then there’s something weird in your sketch. Can you upload your whole project?

1 Like

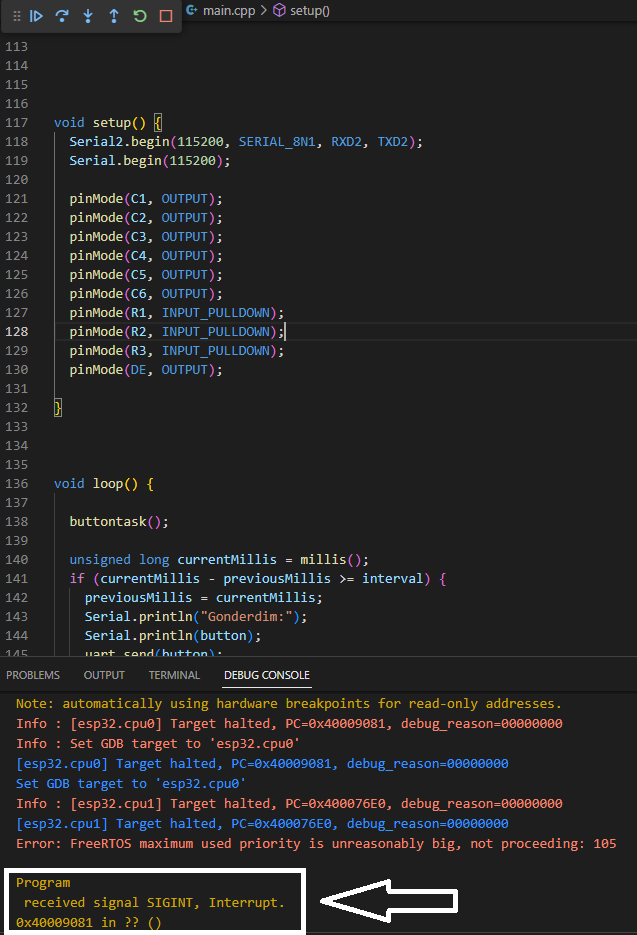
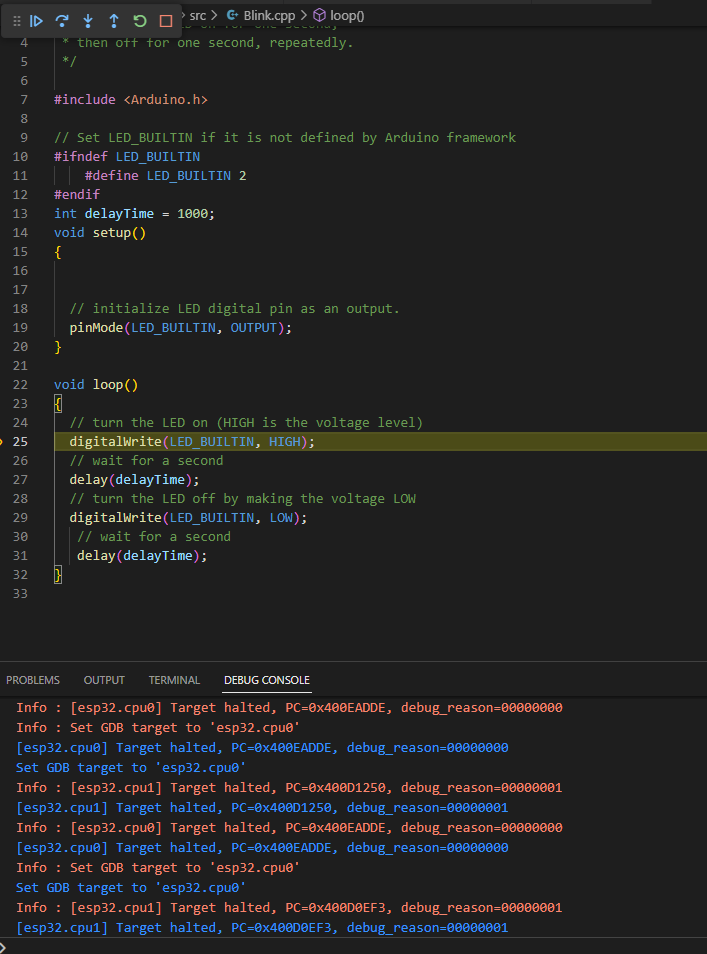
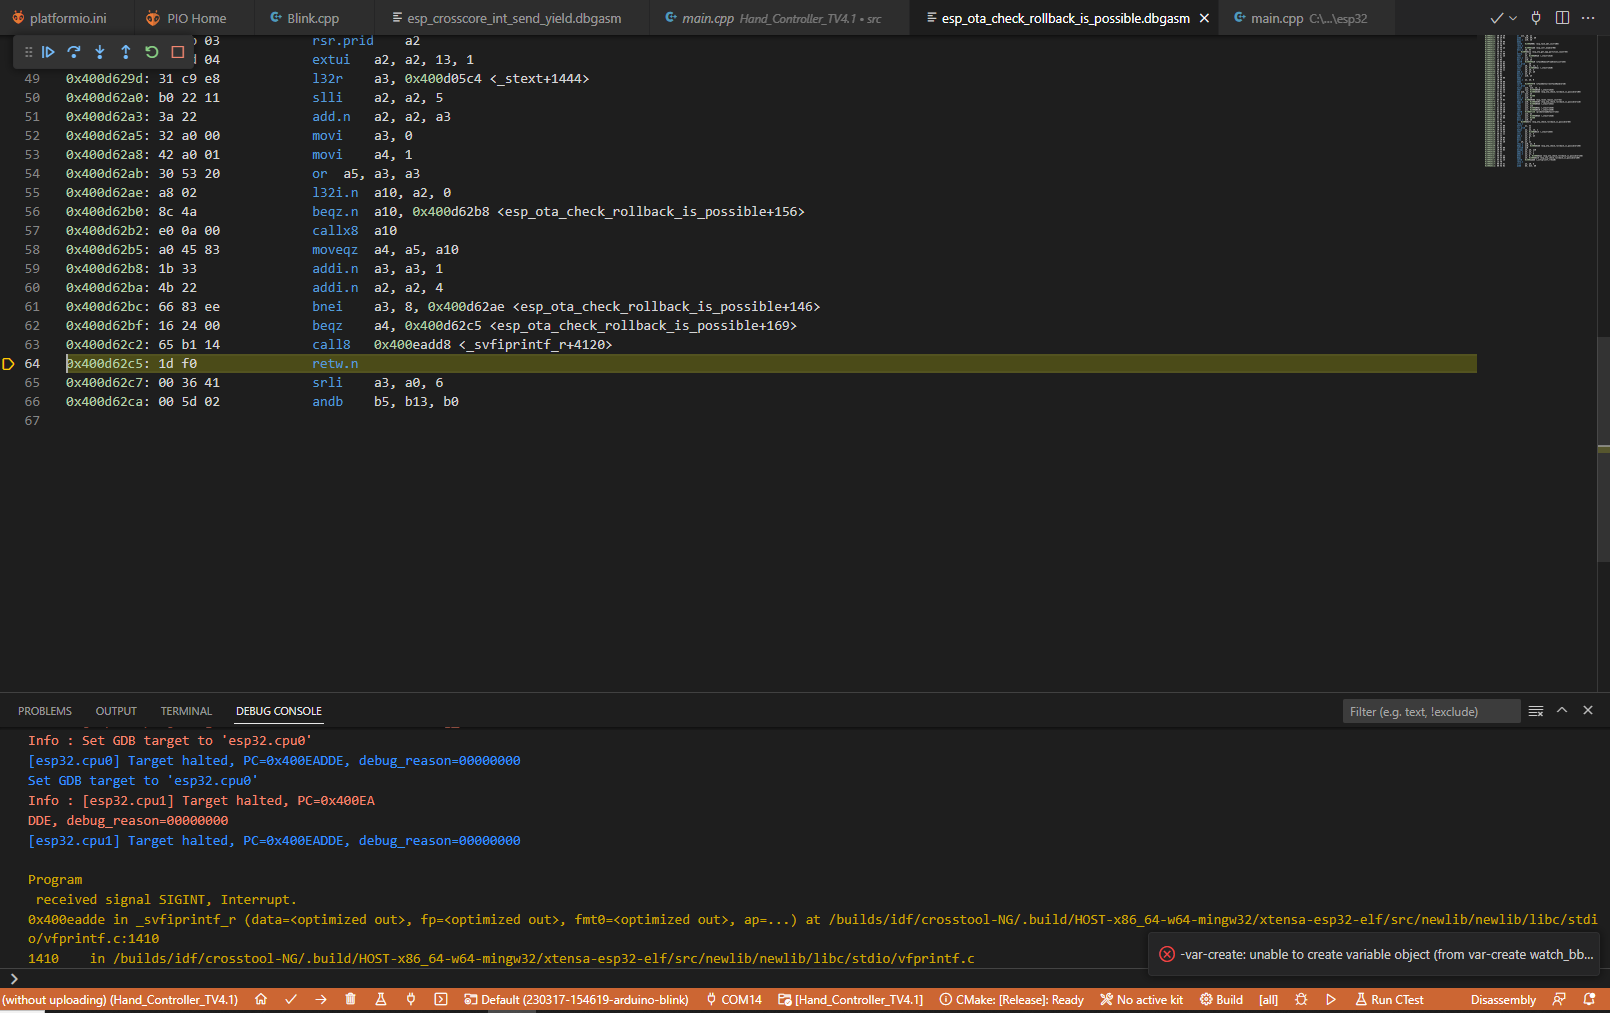
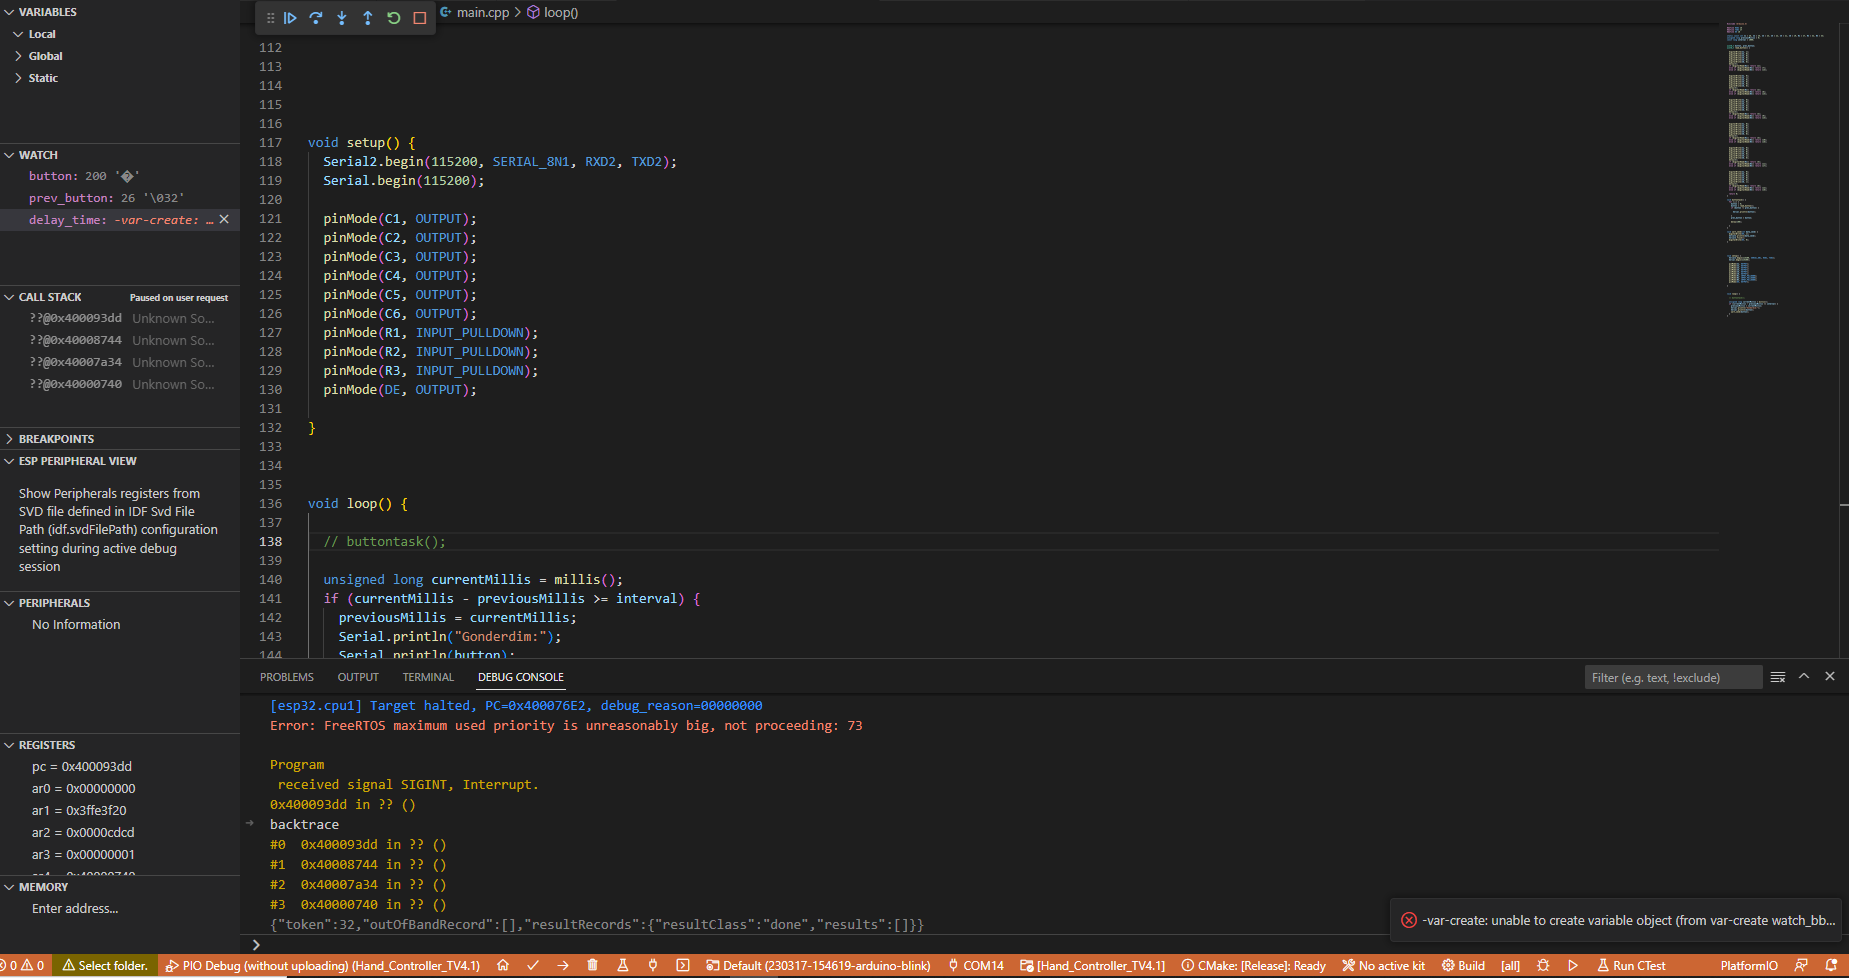
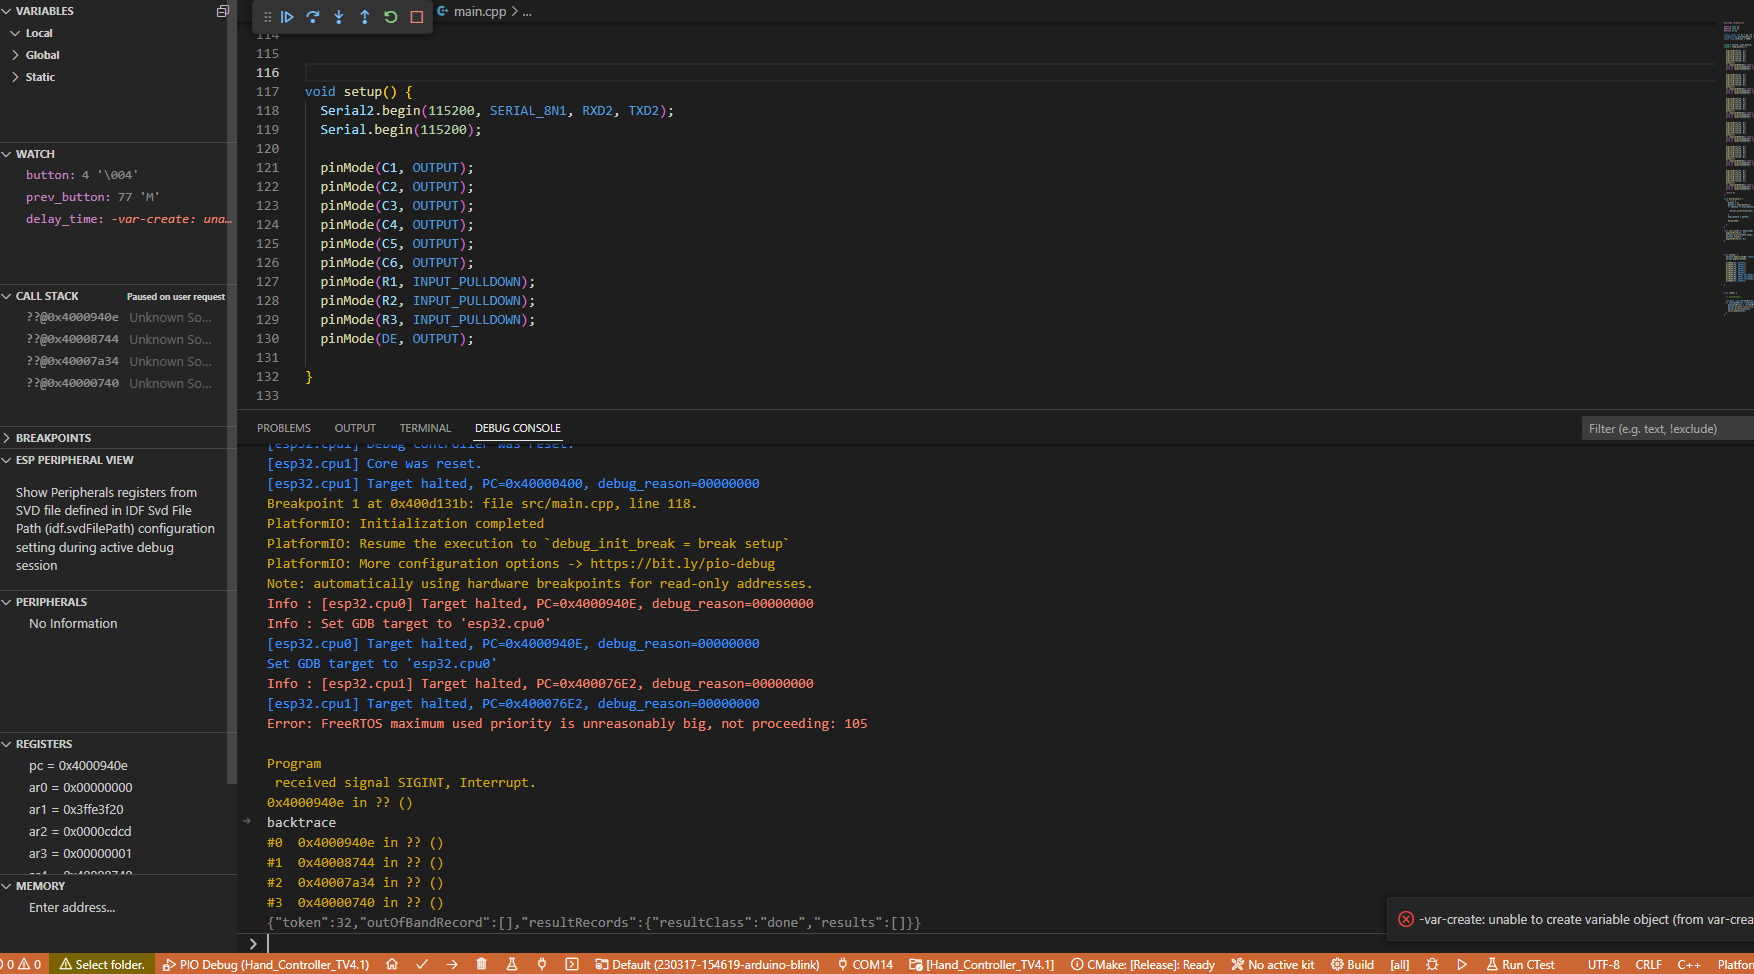
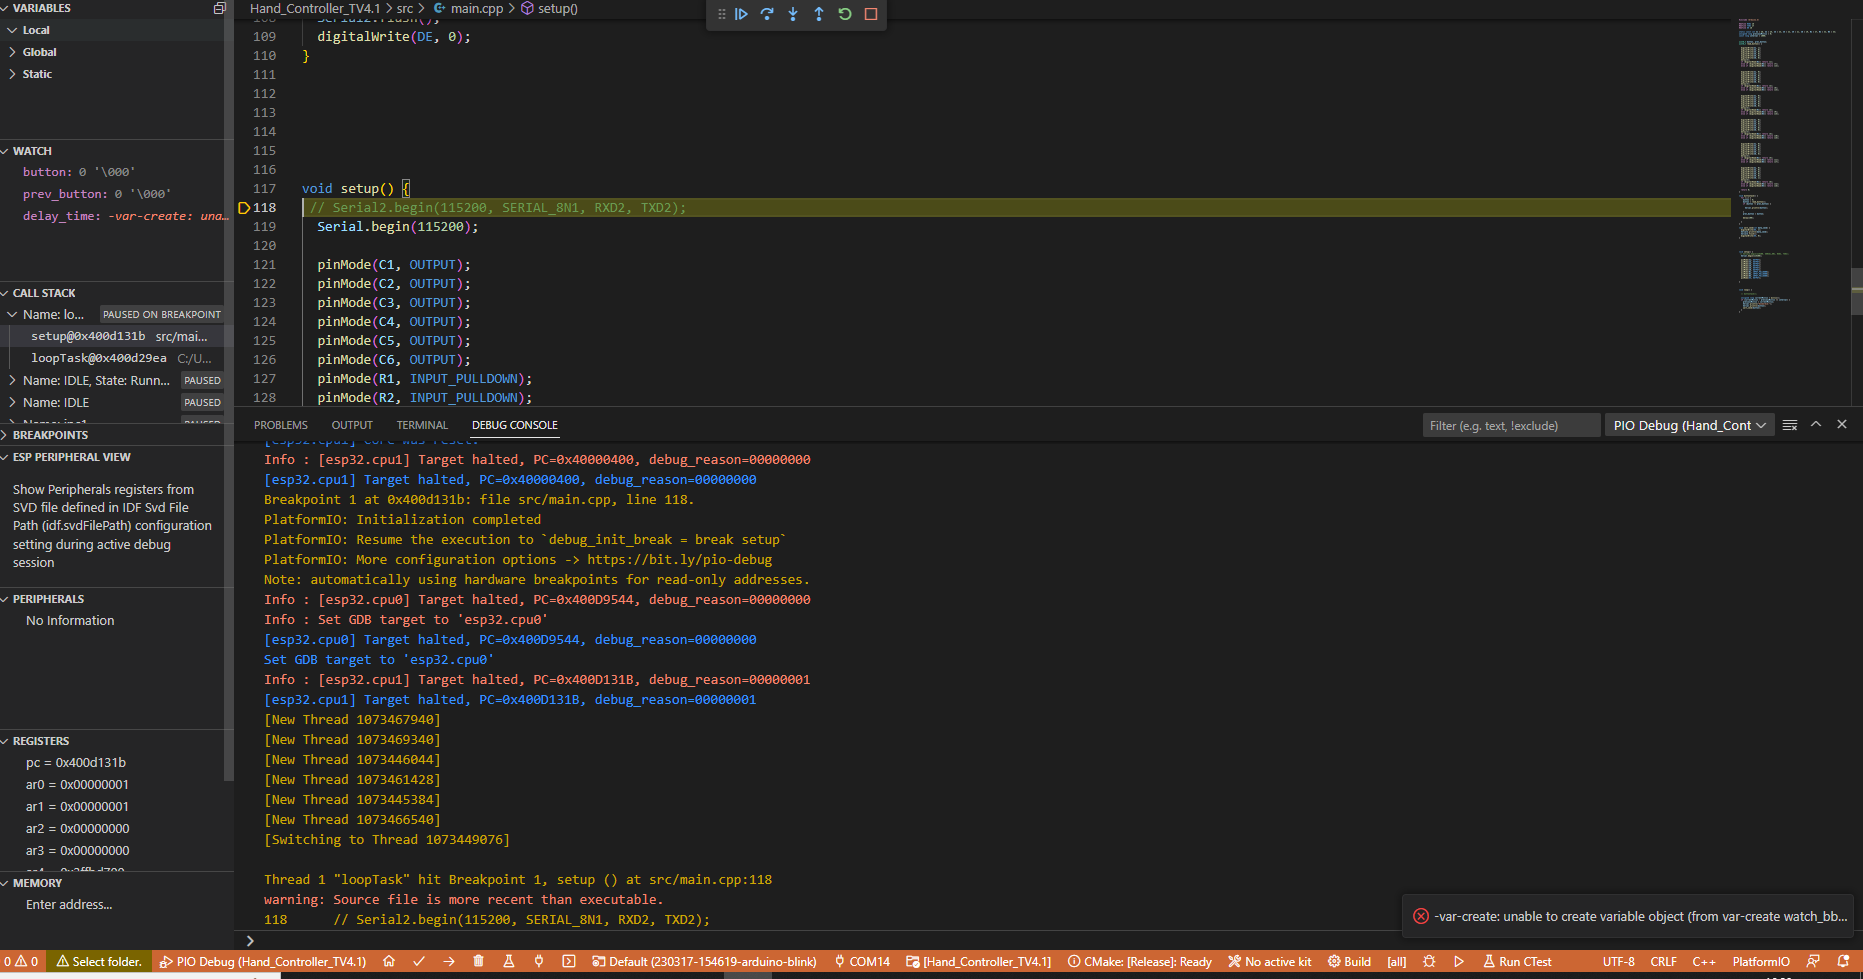
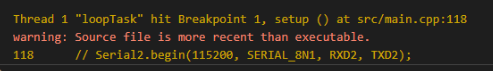
I tried to debug again with my project. When debug started, i paused the debug as you said. Then the cursor returned here.
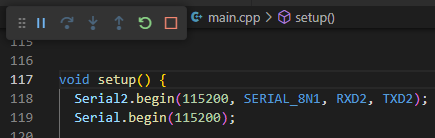
Here is my code.

#include <Arduino.h>

#define RXD2 16
#define TXD2 17
#define DE 18

static const int C1 = 26, C2 = 25, C3 = 23, C4 = 22, C5 = 21, C6 = 19, R1 = 27, R2 = 32, R3 = 33;
unsigned long previousMillis = 0;
const long interval = 1000;


uint8_t button, prev_button;
uint8_t read_button() {

  digitalWrite(C1, 1);
  digitalWrite(C2, 0);
  digitalWrite(C3, 0);
  digitalWrite(C4, 0);
  digitalWrite(C5, 0);
  digitalWrite(C6, 0);
  delay(3);
  if (digitalRead(R1)) return (1);
  else if (digitalRead(R2)) return (7);
  else if (digitalRead(R3)) return (13);


  digitalWrite(C1, 0);
  digitalWrite(C2, 1);
  digitalWrite(C3, 0);
  digitalWrite(C4, 0);
  digitalWrite(C5, 0);
  digitalWrite(C6, 0);
  delay(3);
  if (digitalRead(R1)) return (2);
  else if (digitalRead(R2)) return (8);
  else if (digitalRead(R3)) return (14);


  digitalWrite(C1, 0);
  digitalWrite(C2, 0);
  digitalWrite(C3, 1);
  digitalWrite(C4, 0);
  digitalWrite(C5, 0);
  digitalWrite(C6, 0);
  delay(3);
  if (digitalRead(R1)) return (3);
  else if (digitalRead(R2)) return (9);
  else if (digitalRead(R3)) return (15);


  digitalWrite(C1, 0);
  digitalWrite(C2, 0);
  digitalWrite(C3, 0);
  digitalWrite(C4, 1);
  digitalWrite(C5, 0);
  digitalWrite(C6, 0);
  delay(3);
  if (digitalRead(R1)) return (4);
  else if (digitalRead(R2)) return (10);
  else if (digitalRead(R3)) return (16);


  digitalWrite(C1, 0);
  digitalWrite(C2, 0);
  digitalWrite(C3, 0);
  digitalWrite(C4, 0);
  digitalWrite(C5, 1);
  digitalWrite(C6, 0);
  delay(3);
  if (digitalRead(R1)) return (5);
  else if (digitalRead(R2)) return (11);
  else if (digitalRead(R3)) return (17);


  digitalWrite(C1, 0);
  digitalWrite(C2, 0);
  digitalWrite(C3, 0);
  digitalWrite(C4, 0);
  digitalWrite(C5, 0);
  digitalWrite(C6, 1);
  delay(3);
  if (digitalRead(R1)) return (6);
  else if (digitalRead(R2)) return (12);
  else if (digitalRead(R3)) return (18);

  return 0;
}

void buttontask() { 
  for (;;) {
    button = 0;
    button = read_button();
    if (button != prev_button) {

      Serial.println(button);

    }
    prev_button = button;

    delay(100);

  }
}

void uart_send(int data_send) {
  digitalWrite(DE, 1);
  Serial2.println(data_send);
  Serial2.flush();
  digitalWrite(DE, 0);
}


void setup() {
  Serial2.begin(115200, SERIAL_8N1, RXD2, TXD2);
  Serial.begin(115200);

  pinMode(C1, OUTPUT);
  pinMode(C2, OUTPUT);
  pinMode(C3, OUTPUT);
  pinMode(C4, OUTPUT);
  pinMode(C5, OUTPUT);
  pinMode(C6, OUTPUT);
  pinMode(R1, INPUT_PULLDOWN);
  pinMode(R2, INPUT_PULLDOWN);
  pinMode(R3, INPUT_PULLDOWN);
  pinMode(DE, OUTPUT);

}


void loop() {

  buttontask();

  unsigned long currentMillis = millis();
  if (currentMillis - previousMillis >= interval) {
    previousMillis = currentMillis;
    Serial.println("Gonderdim:");
    Serial.println(button);
    uart_send(button);
  }
}

Enter backtrace in the Debug Console. What’s the output?

That makes no sense because the buttontask() function is forever blocking. Can you comment out that line and retest?

1 Like

You can see the output of the backtrace by this image.

Also I tried to pause and continue the debug for call stack / backtrace. The cursor didn’t return to anywhere.

But you also have the debug configuration “Debug without uploading” selected, is the backtrace different when you select the regular PIO Debug?

1 Like

“regular PIO Debug” option chosen and debug started.

Here, you can see the backtrace.

Almost looks like it is executing bootloader mode to me and not your application at all. Might be due to ESP32’s GPIO strapping pins forcing it into a different mode.

In the datasheet I’ve also seen that GPIO16 and GPIO17 are special. Can you comment out Serial2.begin(..); so that it doesn’t touch those and retry?

1 Like

The datasheet which you sent isn’t belong my ESP32. ESP-WROOM-32 is the model which i use in my project.


This is schematic of my project and the pins (chip pins of not recommended for other usage) just used for JTAG connection.

I commented out Serial2.begin(..) and tried again. Here is the output of backtrace


Program
 received signal SIGINT, Interrupt.
0x400093ba in ?? ()
backtrace
#0  0x400093ba in ?? ()
#1  0x400093f4 in ?? ()
#2  0x40008744 in ?? ()
#3  0x40007a34 in ?? ()
#4  0x40000740 in ?? ()
{"token":32,"outOfBandRecord":[],"resultRecords":{"resultClass":"done","results":[]}}

But an ESP-WROOM-32 module is based on a ESP32-D0WD chip.

image

But okay, if it doesn’t make a difference I guess it was not that. You can further try to comment out lines in your code (regarding calling functions, initializing pins as input/output) until it’s debuggable again. Otherwise I’ll have to test with my ESP32 and debugger later what’s going on.

1 Like

I don’t know what I did, but I tried to debug again after pressing the reset button a few times and entering and exiting the boot mode a few times. Debug seems to be working fine now. How do you think this could have happened?

image
But it’s not properly uploaded the firmware. Can you do an Upload again?