The problem is when the “Start Debugging” is invoke the break at setup never occurs.
The blue scrolling bar in the upper left corner scrolls by several times but stops after
several seconds.
I’ve had this working in the past but can’t seem to narrow down the issue.
I’ve tried reloading zadig/ftdi drivers, PIO.
Checked wiring and all connections.
Searched for possible solutions.
Nothing seems to resolve my issue.
I’ve included the following outputs/logs.
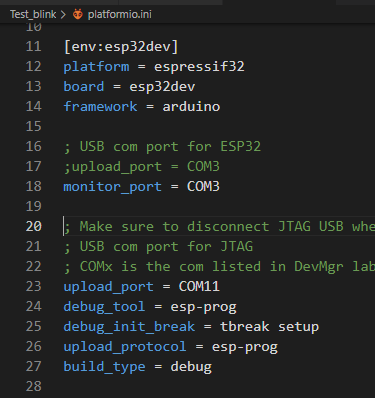
- Platformio.ini
- Debug Console output
- Verbose log
From PIO terminal > pio run -t upload -v
and nothing seems to be an issue, see output below.
Any input would be appreciated.
================== Platformio.ini ========================
=============== Debug Console output ==================
Reading symbols from c:\Users\jake\Documents\PlatformIO\Projects\TestFiles\Test_blink\.pio\build\esp32dev\firmware.elf...

done.

PlatformIO Unified Debugger -> https://bit.ly/pio-debug

PlatformIO: debug_tool = esp-prog

PlatformIO: Initializing remote target...

Open On-Chip Debugger v0.10.0-esp32-20190708 (2019-07-08-11:04)

Licensed under GNU GPL v2

For bug reports, read

http://openocd.org/doc/doxygen/bugs.html

none separate

adapter speed: 10 kHz

Info : Configured 2 cores

esp32 interrupt mask on

Info : tcl server disabled

Info : telnet server disabled

Error: libusb_open() failed with LIBUSB_ERROR_ACCESS

Error: no device found

Error: unable to open ftdi device with vid 0403, pid 6010, description '*', serial '*' at bus location '*'

Warn : Flash driver of esp32.flash does not support free_driver_priv()

Warn : Flash driver of irom does not support free_driver_priv()
I’ve been trying to connect to JTAG with my ESP32.
I’ve looked at several posts and tried diff things but no solution.
I’ve checked and rechecked my wiring, ftdi and zadig and it seems to be ok.
====================== Verbose Log =========================================
C:\Users\jake\Documents\PlatformIO\Projects\TestFiles\Test_blink>pio run -t upload -v
Processing esp32dev (platform: espressif32; board: esp32dev; framework: arduino; monitor_port: COM3; upload_port: COM11; debug_tool: esp-prog; debug_init_break: tbreak setup; upload_protocol: esp-prog; build_type: debug)
-------------------------------------------------------------------------------------------------------------CONFIGURATION: https://docs.platformio.org/page/boards/espressif32/esp32dev.html
PLATFORM: Espressif 32 (1.11.2) > Espressif ESP32 Dev Module
HARDWARE: ESP32 240MHz, 320KB RAM, 4MB Flash
DEBUG: Current (esp-prog) External (esp-prog, iot-bus-jtag, jlink, minimodule, olimex-arm-usb-ocd, olimex-arm-usb-ocd-h, olimex-arm-usb-tiny-h, olimex-jtag-tiny, tumpa)
PACKAGES:
 - framework-arduinoespressif32 3.10004.200129 (1.0.4)
 - tool-esptoolpy 1.20600.0 (2.6.0)
 - tool-mkspiffs 2.230.0 (2.30)
 - tool-openocd-esp32 1.1000.20190709 (10.0)
 - toolchain-xtensa32 2.50200.80 (5.2.0)
LDF: Library Dependency Finder -> https://bit.ly/configure-pio-ldf
LDF Modes: Finder ~ chain, Compatibility ~ soft
Framework incompatible library C:\Users\jake\.platformio\lib\SoftwareSerial_ID2728
Found 29 compatible libraries
More details about "Library Compatibility Mode": https://docs.platformio.org/page/librarymanager/ldf.html#ldf-compat-mode
Scanning dependencies...
No dependencies
Building in debug mode
<lambda>(["checkprogsize"], [".pio\build\esp32dev\firmware.elf"])
MethodWrapper(["checkprogsize"], [".pio\build\esp32dev\firmware.elf"])
Advanced Memory Usage is available via "PlatformIO Home > Project Inspect"
RAM:   [          ]   4.7% (used 15348 bytes from 327680 bytes)
Flash: [==        ]  16.1% (used 211017 bytes from 1310720 bytes)
.pio\build\esp32dev\firmware.elf  :

section                                                         size         addr

.rtc.text                                                          0   1074528256

.rtc.dummy                                                         0   1073217536

.rtc.force_fast                                                    0   1073217536

.rtc_noinit                                                        0   1342177792

.rtc.force_slow                                                    0   1342177792

.iram0.vectors                                                  1024   1074266112

.iram0.text                                                    55612   1074267136

.dram0.data                                                     9532   1073470304

.noinit                                                            0   1073479836

.dram0.bss                                                      5816   1073479840

.flash.rodata                                                  45388   1061158944

.flash.text                                                    99461   1074593816

.debug_frame                                                   78632            0

.debug_info                                                  1391175            0

.debug_abbrev                                                 175510            0

.debug_loc                                                    513244            0

.debug_aranges                                                 30912            0

.debug_ranges                                                  33096            0

.debug_line                                                   690794            0

.debug_str                                                    894409            0

.comment                                                         419            0

.xtensa.info                                                      56            0

.xt.prop._ZTV9Printable                                           12            0

.xt.lit._ZN9IPAddressD5Ev                                          0            0

.xt.prop._ZN9IPAddressD5Ev                                         0            0

.xt.prop._ZN9IPAddressD2Ev                                        36            0

.xt.prop._ZN9IPAddressD0Ev                                        36            0

.xt.prop._ZTV9IPAddress                                           12            0

.xt.lit._ZN5Print5writeEPKc                                        8            0

.xt.prop._ZN5Print5writeEPKc                                      60            0

.xt.lit._ZN6String4initEv                                          8            0

.xt.prop._ZN6String4initEv                                        60            0

.xt.prop._ZNK6String3lenEv                                        60            0

.xt.prop._ZN6String6setLenEi                                      60            0

.xt.prop._ZNK6String7wbufferEv                                    48            0

.xt.prop._ZTISt9exception                                         12            0

.xt.prop._ZTISt9bad_alloc                                         12            0

.xt.prop._ZTVN10__cxxabiv117__class_type_infoE                    12            0

.xt.lit._ZNK9__gnu_cxx24__concurrence_lock_error4whatEv            8            0

.xt.lit._ZNK9__gnu_cxx26__concurrence_unlock_error4whatEv          8            0

.xt.lit._ZN9__gnu_cxx24__concurrence_lock_errorD5Ev                8            0

.xt.lit._ZN9__gnu_cxx26__concurrence_unlock_errorD5Ev              8            0

.xt.lit._ZN9__gnu_cxx7__mutex4lockEv                               8            0

.xt.lit._ZN9__gnu_cxx13__scoped_lockD5Ev                           8            0

.xt.prop._ZNK9__gnu_cxx24__concurrence_lock_error4whatEv          48            0

.xt.prop._ZNK9__gnu_cxx26__concurrence_unlock_error4whatEv        48            0

.xt.prop._ZN9__gnu_cxx24__concurrence_lock_errorD5Ev              12            0

.xt.prop._ZN9__gnu_cxx26__concurrence_unlock_errorD5Ev            12            0

.xt.prop._ZN9__gnu_cxx7__mutex4lockEv                             60            0

.xt.prop._ZN9__gnu_cxx13__scoped_lockD5Ev                         12            0

.xt.prop._ZN9__gnu_cxx24__concurrence_lock_errorD2Ev              36            0

.xt.prop._ZN9__gnu_cxx26__concurrence_unlock_errorD2Ev            36            0

.xt.prop._ZN9__gnu_cxx24__concurrence_lock_errorD0Ev              36            0

.xt.prop._ZN9__gnu_cxx26__concurrence_unlock_errorD0Ev            36            0

.xt.prop._ZN9__gnu_cxx13__scoped_lockD2Ev                         72            0

.xt.prop._ZTIN9__gnu_cxx24__concurrence_lock_errorE               12            0

.xt.prop._ZTIN9__gnu_cxx26__concurrence_unlock_errorE             12            0

.xt.prop._ZTVN9__gnu_cxx24__concurrence_lock_errorE               12            0

.xt.prop._ZTVN9__gnu_cxx26__concurrence_unlock_errorE             12            0

.xt.prop._ZTVSt9bad_alloc                                         12            0

.xt.prop._ZTVN10__cxxabiv120__si_class_type_infoE                 12            0

.debug_macro                                                  153843            0

Total                                                        4179887
<lambda>(["upload"], [".pio\build\esp32dev\firmware.bin"])
AVAILABLE: esp-prog, espota, esptool, iot-bus-jtag, jlink, minimodule, olimex-arm-usb-ocd, olimex-arm-usb-ocd-h, olimex-arm-usb-tiny-h, olimex-jtag-tiny, tumpa
CURRENT: upload_protocol = esp-prog
openocd -d2 -s C:/Users/jake/.platformio/packages/tool-openocd-esp32/share/openocd/scripts -f interface/ftdi/esp32_devkitj_v1.cfg -f board/esp-wroom-32.cfg -c "program_esp32 {{.pio\build\esp32dev\firmware.bin}} 0x10000 verify" -c "program_esp32 {{C:/Users/jake/.platformio/packages/framework-arduinoespressif32/tools/sdk/bin/bootloader_dio_40m.bin}} 0x1000 verify" -c "program_esp32 {{C:/Users/jake/Documents/PlatformIO/Projects/TestFiles/Test_blink/.pio/build/esp32dev/partitions.bin}} 0x8000 verify" -c "program_esp32 {{C:/Users/jake/.platformio/packages/framework-arduinoespressif32/tools/partitions/boot_app0.bin}} 0xe000 verify" -c "reset run; shutdown"
Open On-Chip Debugger  v0.10.0-esp32-20190708 (2019-07-08-11:04)
Licensed under GNU GPL v2
For bug reports, read
        http://openocd.org/doc/doxygen/bugs.html
debug_level: 2
none separate
adapter speed: 10 kHz
Info : Configured 2 cores
esp32 interrupt mask on
Info : clock speed 10 kHz
Info : JTAG tap: esp32.cpu0 tap/device found: 0x120034e5 (mfg: 0x272 (Tensilica), part: 0x2003, ver: 0x1)
Info : JTAG tap: esp32.cpu1 tap/device found: 0x120034e5 (mfg: 0x272 (Tensilica), part: 0x2003, ver: 0x1)
Info : Target halted. PRO_CPU: PC=0x400E8252 (active)    APP_CPU: PC=0x400E8252
Info : Detected debug stubs @ 3ffc0c4c on core0 of target 'esp32'
Info : Listening on port 3333 for gdb connections
Info : JTAG tap: esp32.cpu0 tap/device found: 0x120034e5 (mfg: 0x272 (Tensilica), part: 0x2003, ver: 0x1)
Info : JTAG tap: esp32.cpu1 tap/device found: 0x120034e5 (mfg: 0x272 (Tensilica), part: 0x2003, ver: 0x1)
Info : esp32: Debug controller 0 was reset (pwrstat=0x5F, after clear 0x0F).
Info : esp32: Core 0 was reset (pwrstat=0x5F, after clear 0x0F).
Info : Target halted. PRO_CPU: PC=0x5000004B (active)    APP_CPU: PC=0x00000000
Info : esp32: Core 0 was reset (pwrstat=0x1F, after clear 0x0F).
Info : esp32: Debug controller 1 was reset (pwrstat=0x5F, after clear 0x0F).
Info : esp32: Core 1 was reset (pwrstat=0x5F, after clear 0x0F).
Info : Target halted. PRO_CPU: PC=0x40000400 (active)    APP_CPU: PC=0x40000400
** Programming Started **
auto erase enabled
Info : Target halted. PRO_CPU: PC=0x400916EE (active)    APP_CPU: PC=0x40000400
Info : Flash mapping 0: 0x10020 -> 0x3f400020, 44 KB
Info : Flash mapping 1: 0x20018 -> 0x400d0018, 97 KB
Info : Target halted. PRO_CPU: PC=0x400916EE (active)    APP_CPU: PC=0x40000400
Info : Auto-detected flash size 4096 KB
Info : Using flash size 4096 KB