(Sorry for “double” title, but it feels like XY problem a bit so I want to broad the context of my issue, which I do believe could be partially solved if I know answer to second part of the title)
I am working on debugging my ESP8266 with GDBStub and I noticed few annoying behaviours. Of course, the debugging experience being poor is also because of platform/hardware, not only PlatformIO, but here I am. Configuration to make it work is a bit non-standard but it works for me for the most part.
My project repo (if some files are required to insight or if anyone is interested): GitHub - AgainPsychoX/TestGDBStubForESP8266
Main problem:
-
Cannot send data to serial.
If I start normal serial monitor, I can pass data to serial output to interact with my app running on the embedded system. Even compiled with debugger symbols and with GDBStub breaks - which still block execution (because current ESP8266 core GDBStub implementation doesn’t have “soft” attached mode), but can be dismissed with
$D#44(without quotes):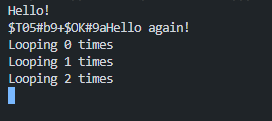
Anyway, the point is I can’t send data while debugging in VS Code (or GDB): it just ignores everything I write OR it sends it to GDB (as command). I found potential solution: add
"console": "externalTerminal"or"internalTerminal", that will hopefully open the serial console in other terminal(?).Problem is, the
launch.jsonis auto-generated, so I can’t permanently change it… Is there some override system I missed? Or is there some expected way to send the data to serial port from GDB I missed?
 -
Arduino
Serial.prints are mangled into separate lines, which makes it harder to read. In large amount of prints and fast rate it’s A LOT less readable.Executing code:
	Serial.print(F("Hello "));
	Serial.print(F("again!\n"));
in the “Debug Console” looks like:
Other things that might be related to PlatformIO, which are not important issues, but worth noticing here:
-
There is no way to automatically discovery of debug port, as there is for monitor/upload port. I need manually specify it in
platformio.inior typetarget remote \\\\.\\COM13ortarget remote \\.\COM13. I wish there was some method to automate it properly. -
Using
debug_init_breakmakes this first breakpoint (if set) skipped anyway… Very weird. I have workaround: setdebug_init_break = #(empty), and add manually command todebug_init_cmds. Not that much annoying its just one more line in the config anyway
-
Every time I press “PIO Debug” the code is reuploaded, even despite I set
debug_load_mode = modified. It doesn’t happen in project I linked, but in other a bit more complex it does. I will try find dig into it this or next weekend tho. -
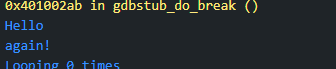
Hitting software breakpoint (call to
gdb_do_break()) opens up invoid app_entry(void)incore_esp8266_main.cpp. It’s weird and only a bit annoying. In other languages there seem to be some parameters to skip/hide some elements in call stack, but it looks like specific debugger extension so I don’t know… Pointless to spend time on it I guess.
Anyway, I would be really welcome for any feedback.