I’m attempting to set up debugging with an EspressIf ESP32-S3- DevKitC-1 and an EspressIF ESP-Prog. Short description - builds and loads fine, fails to debug - first error: JTAG scan chain interrogation failed: all zeroes
Details -
Windows 10Pro – 8gb
VS Code version 1.68.1 6/14/2022
Platformio.ini
[env:esp32-s3-devkitc-1]
platform = espressif32
board = esp32-s3-devkitc-1
framework = arduino
monitor_speed = 115200
debug_tool = esp-prog
build_type = debug
debug_init_break = tbreak setup
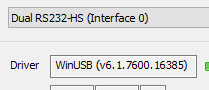
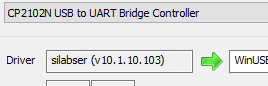
Ran Zadig
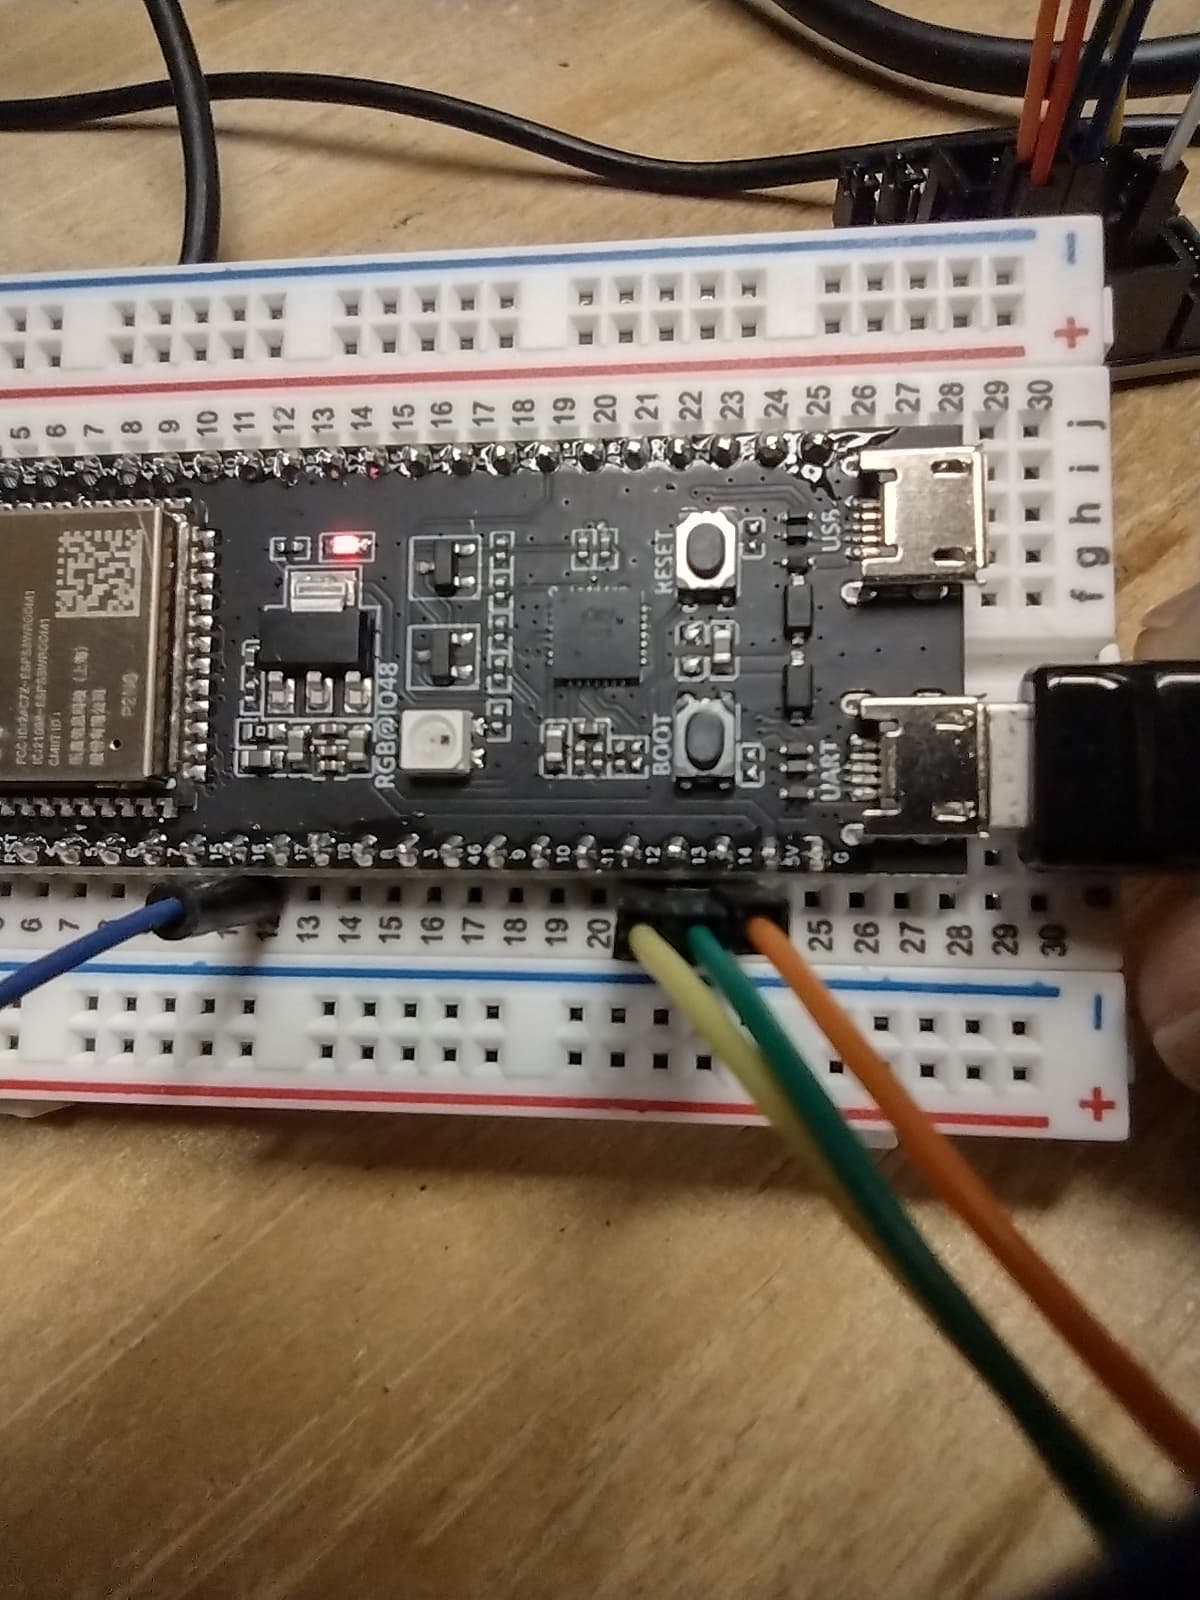
Have two USB connections.
First is from CP2012N USB port to DevKit board. Plugged into the UART (not USB) port on DevKit board.
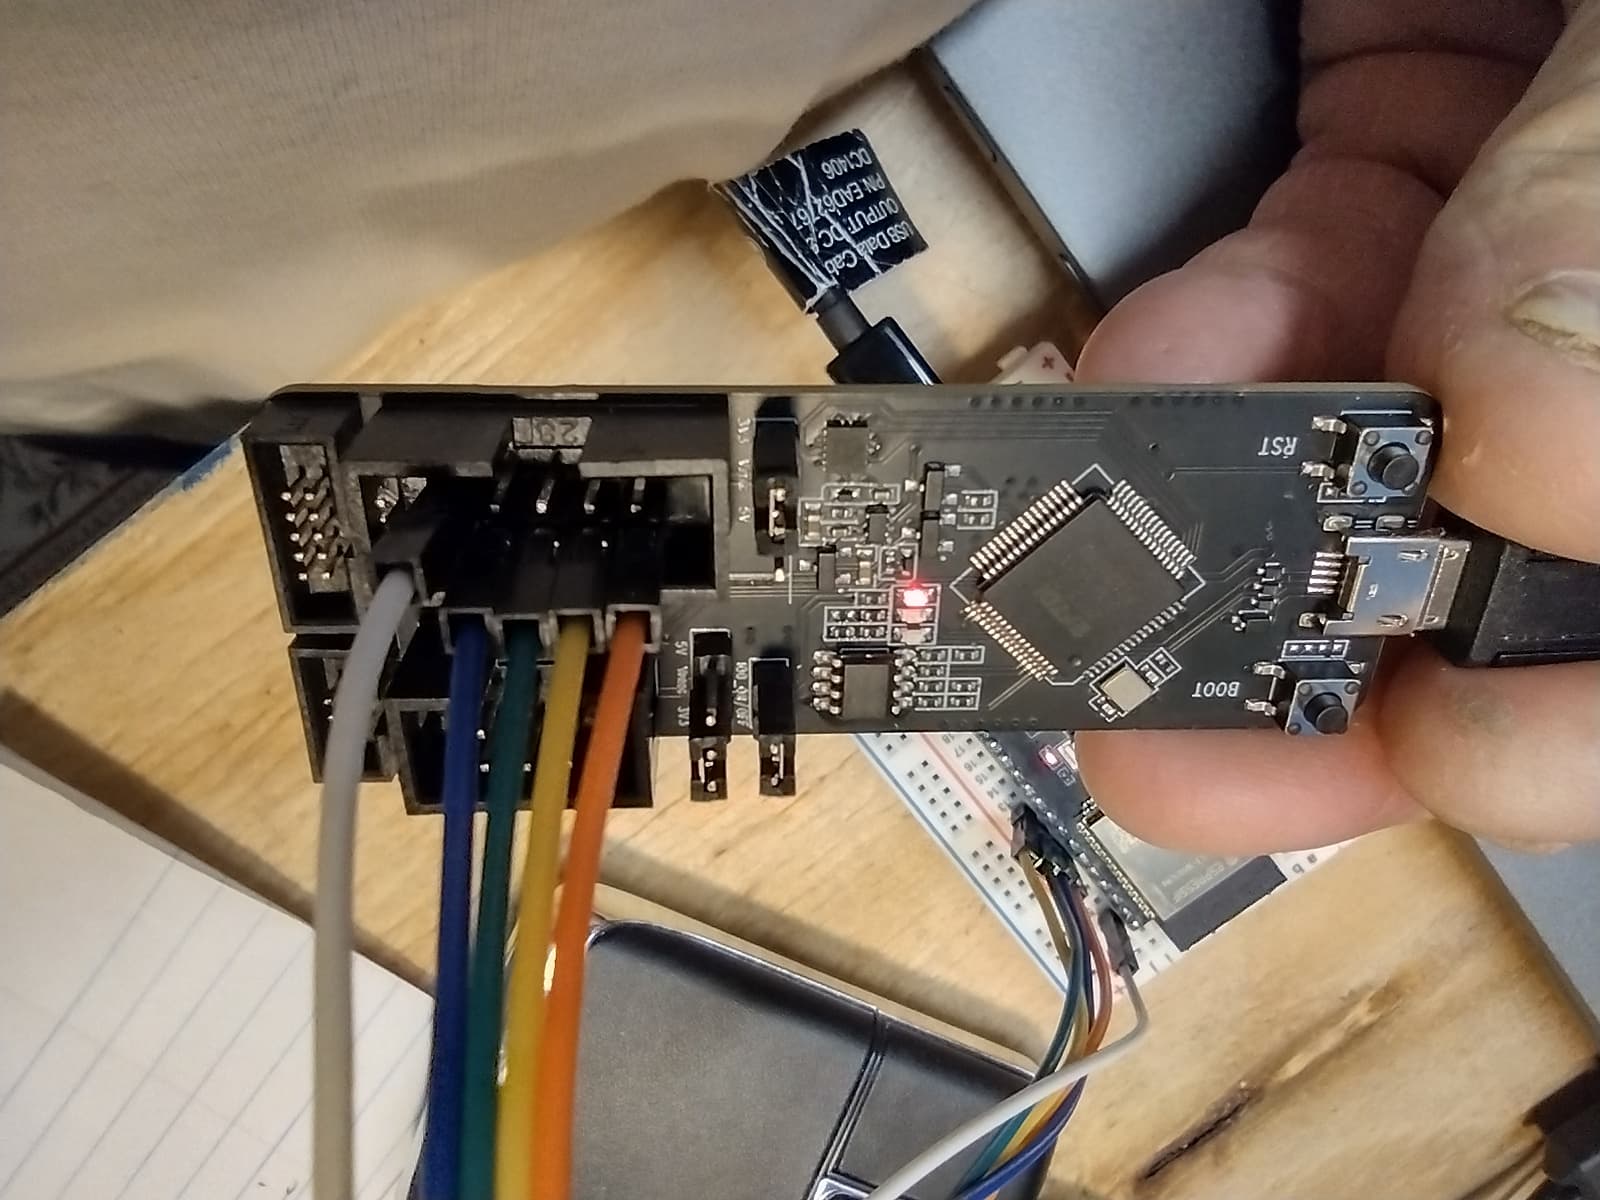
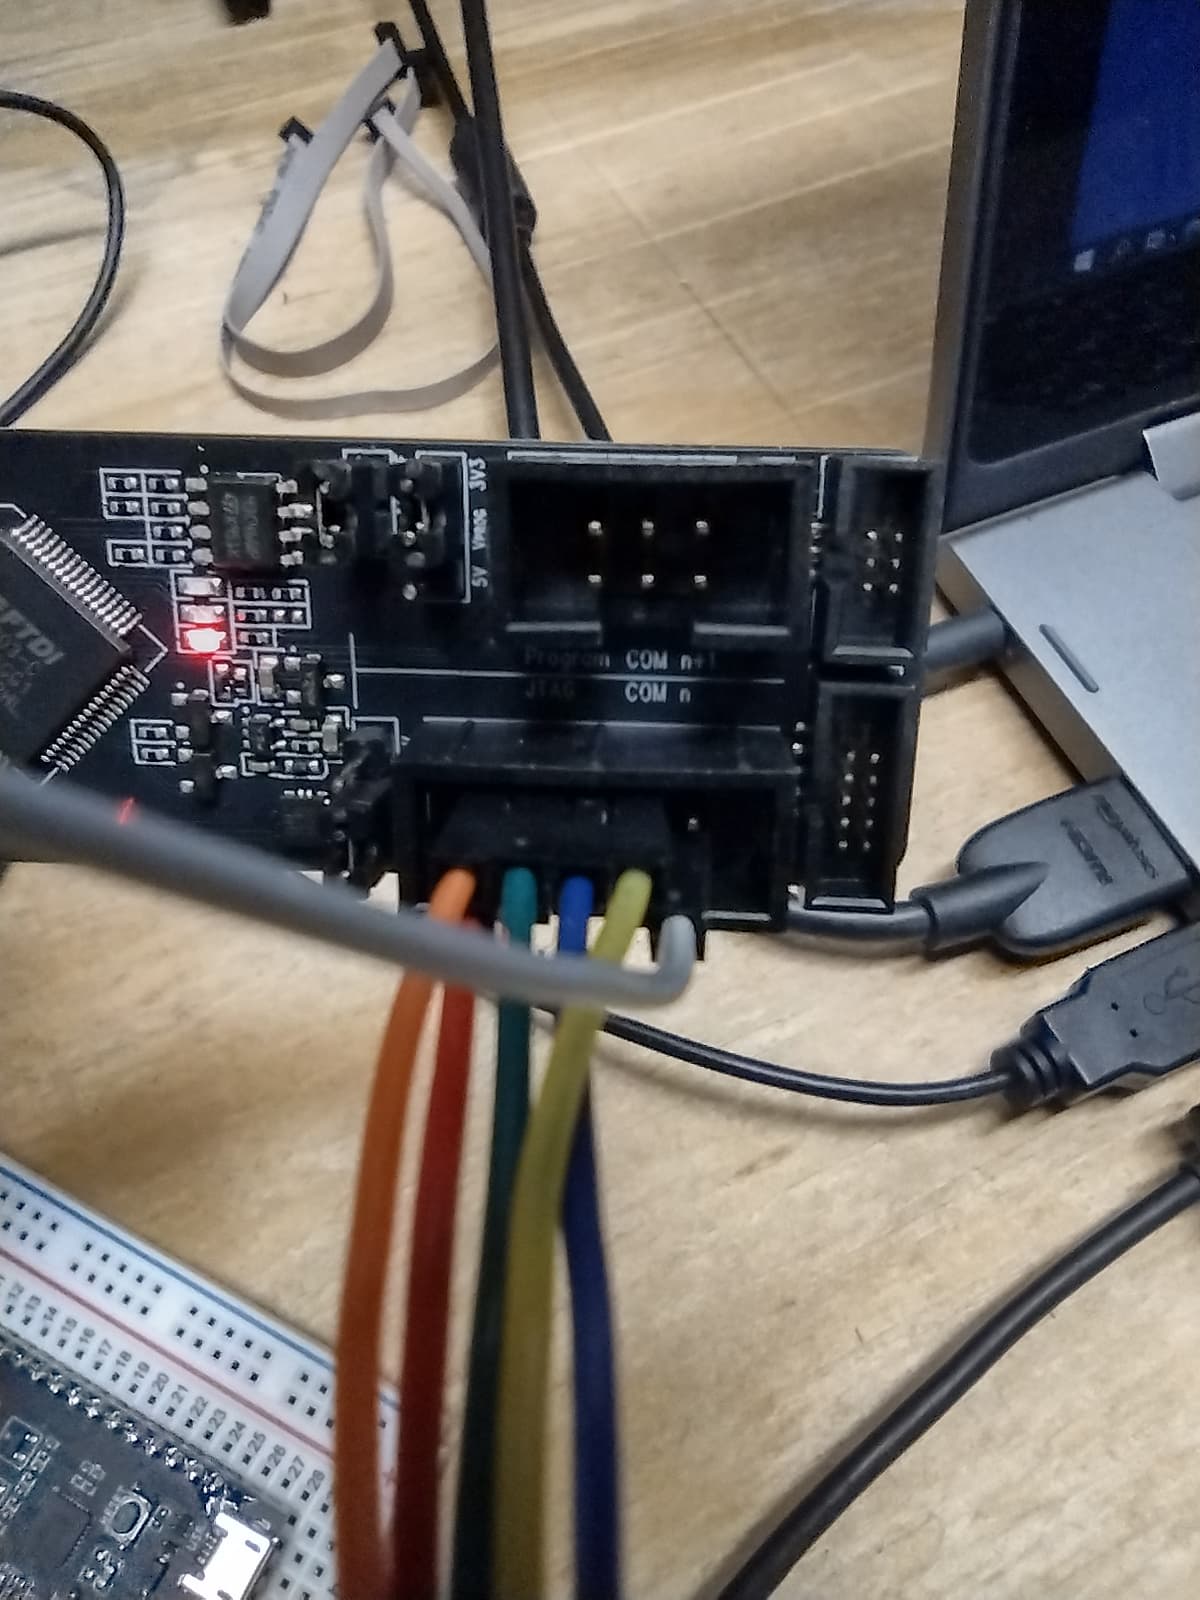
Second is from RS232-HS to ESP-Prog
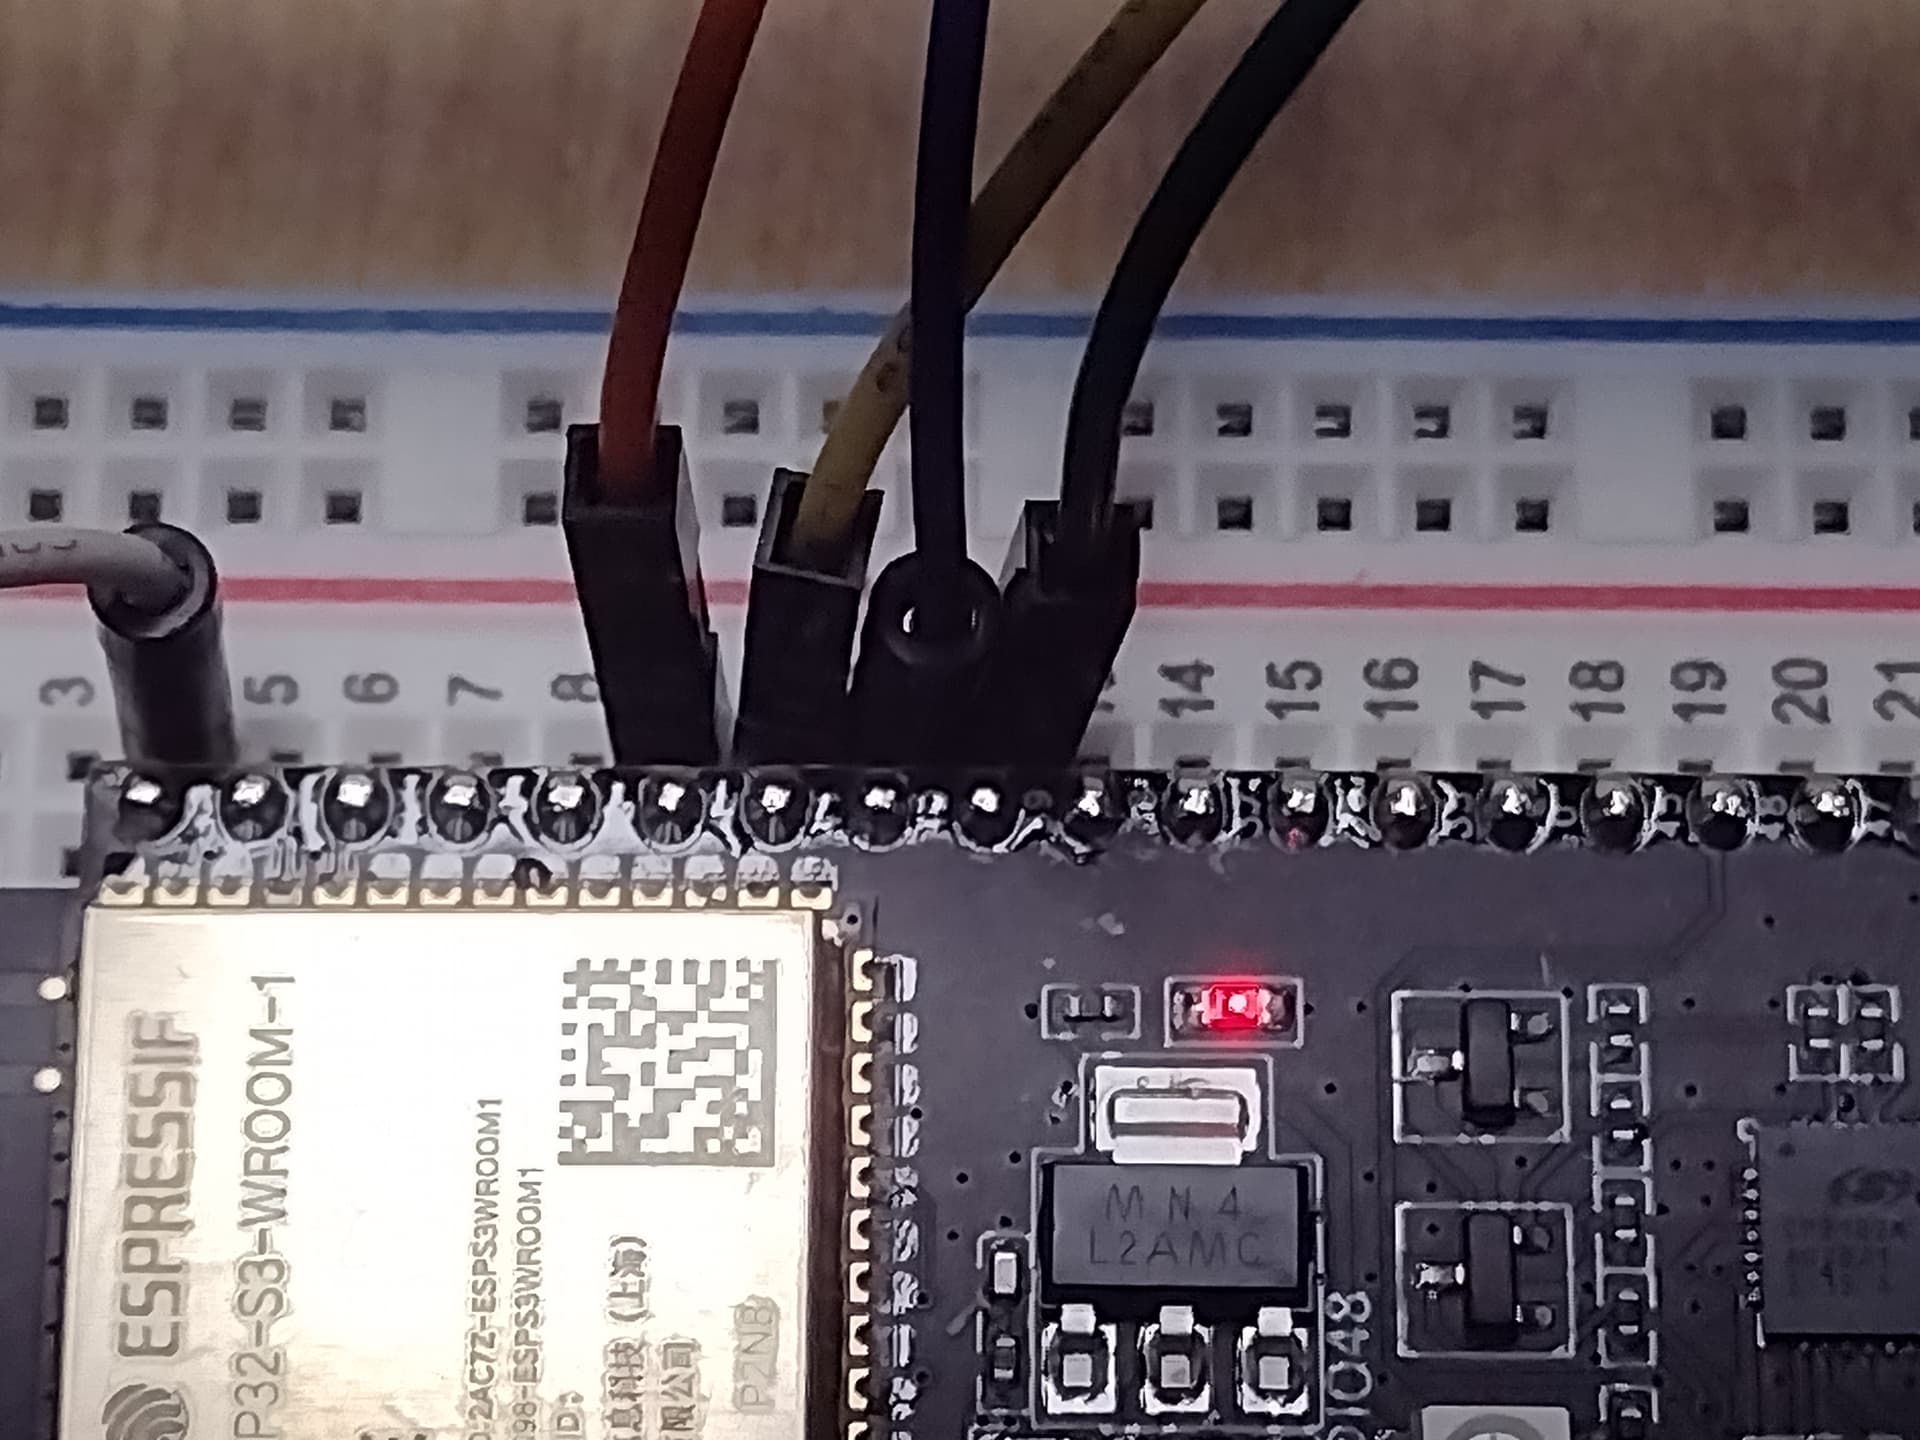
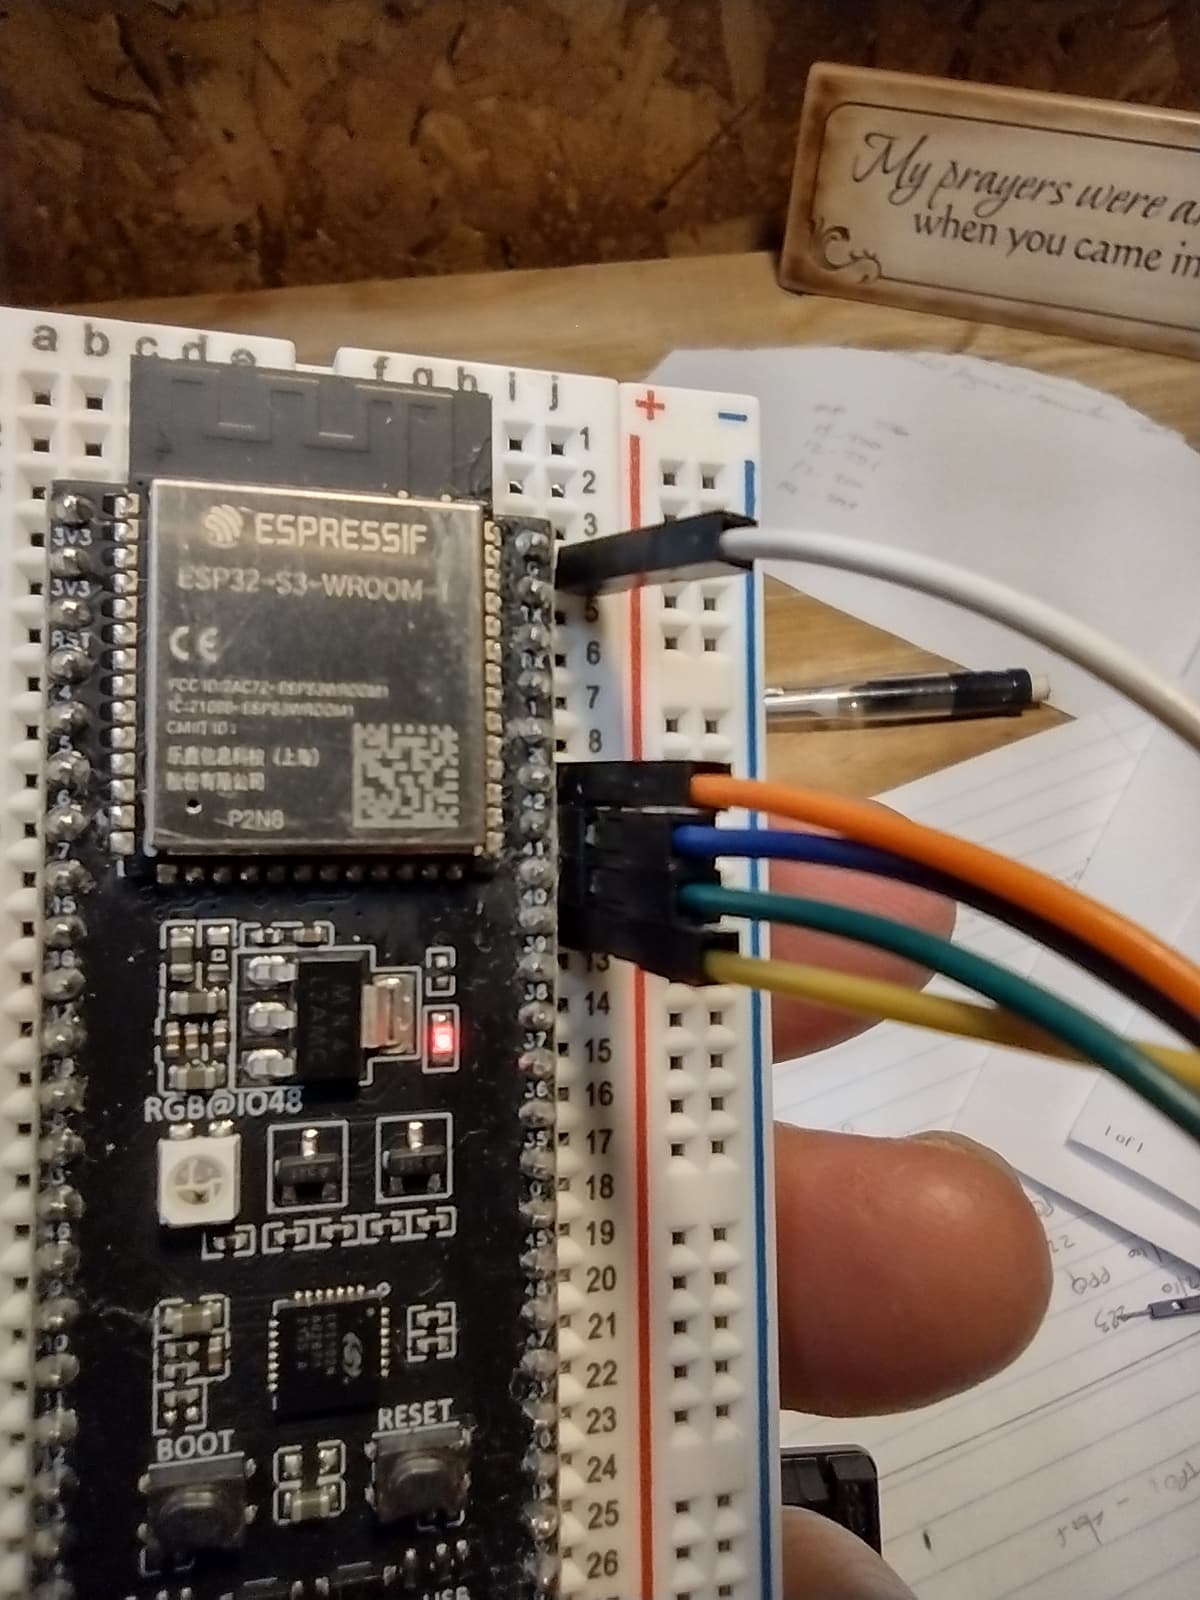
ESP-Prog wiring TMS			GPIO 14	DevKit
                TCK			GPIO 13
                TDO			GPIO 15
                TDI			GPIO 12
Using ‘Scan Wifi’ example. Compiles fine, loads fine, console monitor shows looping statements and identified networks.
Build
Processing esp32-s3-devkitc-1 (platform: espressif32; board: esp32-s3-devkitc-1; framework: arduino)
-------------------------------------------------------------------------------------------------------------------------------------------------------------------------------------------Verbose mode can be enabled via `-v, --verbose` option
CONFIGURATION: https://docs.platformio.org/page/boards/espressif32/esp32-s3-devkitc-1.html
PLATFORM: Espressif 32 (4.4.0) > Espressif ESP32-S3-DevKitC-1
HARDWARE: ESP32S3 240MHz, 320KB RAM, 4MB Flash
DEBUG: Current (esp-prog) External (cmsis-dap, esp-prog, iot-bus-jtag, jlink, minimodule, olimex-arm-usb-ocd, olimex-arm-usb-ocd-h, olimex-arm-usb-tiny-h, olimex-jtag-tiny, tumpa)
PACKAGES:
 - framework-arduinoespressif32 @ 3.20003.220613 (2.0.3)
 - tool-esptoolpy @ 1.30300.0 (3.3.0)
 - toolchain-riscv32-esp @ 8.4.0+2021r2-patch3
 - toolchain-xtensa-esp32s3 @ 8.4.0+2021r2-patch3
LDF: Library Dependency Finder -> https://bit.ly/configure-pio-ldf
LDF Modes: Finder ~ chain, Compatibility ~ soft
Found 32 compatible libraries
Scanning dependencies...
Dependency Graph
|-- WiFi @ 2.0.0
Building in debug mode
Retrieving maximum program size .pio\build\esp32-s3-devkitc-1\firmware.elf
Checking size .pio\build\esp32-s3-devkitc-1\firmware.elf
Advanced Memory Usage is available via "PlatformIO Home > Project Inspect"
RAM:   [=         ]  11.3% (used 37152 bytes from 327680 bytes)
Flash: [=====     ]  45.2% (used 592849 bytes from 1310720 bytes)
=============================================================================== [SUCCESS] Took 9.02 seconds
Debug console
undefinedC:\Users\Greg\.platformio\packages\toolchain-xtensa-esp32s3\bin\xtensa-esp32s3-elf-gdb.exe: warning: Couldn't determine a path for the index cache directory.
Reading symbols from c:\Users\Greg\Documents\PlatformIO\Projects\devkit-1\.pio\build\esp32-s3-devkitc-1\firmware.elf...
PlatformIO Unified Debugger -> https://bit.ly/pio-debug
PlatformIO: debug_tool = esp-prog
PlatformIO: Initializing remote target...
Open On-Chip Debugger v0.11.0-esp32-20220411 (2022-04-11-08:48)
Licensed under GNU GPL v2
For bug reports, read
http://openocd.org/doc/doxygen/bugs.html
adapter speed: 20000 kHz
DEPRECATED! use 'adapter speed' not 'adapter_khz'
adapter speed: 5000 kHz
Info : tcl server disabled
Info : telnet server disabled
Info : clock speed 5000 kHz
Error: JTAG scan chain interrogation failed: all zeroes
Error: Check JTAG interface, timings, target power, etc.
Error: Trying to use configured scan chain anyway...
Error: esp32s3.cpu0: IR capture error; saw 0x00 not 0x01
Warn : Bypassing JTAG setup events due to errors
Warn : target esp32s3.cpu0 examination failed
Warn : target esp32s3.cpu1 examination failed
Info : starting gdb server for esp32s3.cpu0 on pipe
Info : accepting 'gdb' connection from pipe
Error: Target not examined yet
Error executing event gdb-attach on target esp32s3.cpu0:
Warn : No symbols for FreeRTOS!
Error: Target not halted
Error: auto_probe failed
Error: Connect failed. Consider setting up a gdb-attach event for the target to prepare target for GDB connect, or use 'gdb_memory_map disable'.
Error: attempted 'gdb' connection rejected
Error: error during select: Unknown error
.pioinit:11: Error in sourced command file:
Remote communication error. Target disconnected.: Success.
Any advice or troubleshooting steps would be greatly appreciated.
Thanks.