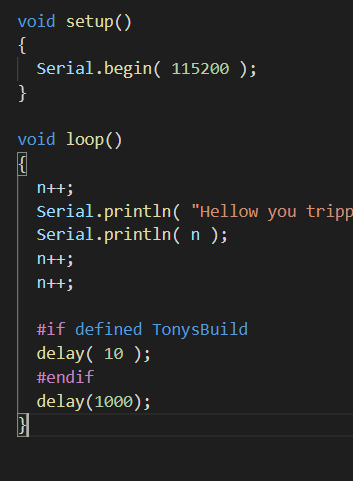
I have a 6 line hello worldish program ( below ) and the debugger does not “step over” instructions properly. It seems to execute the n++ on line 21 and the println on 22 but then loops back to line 21 with no output on the serial port. It does not even try to execute lines 24-26. It runs OK if I “resume”… it prints to the serial port and breaks at the next iteration of the loop. I have modified various times the print text so I can tell that the new code is uploading to the board OK. I usually performed a CLEAN before each try.
I am running an ESP32 dev board and an ESP-Prog debugger.
Thanks,
Tony
The Code:
unsigned int n = 0;
void setup()
{
** Serial.begin( 115200 );**
}
void loop()
{
** n++;**
** Serial.println( “Hellow you tripple dog dirty rat” );**
I have made some progress, finally found the help for some of the debug build flags.
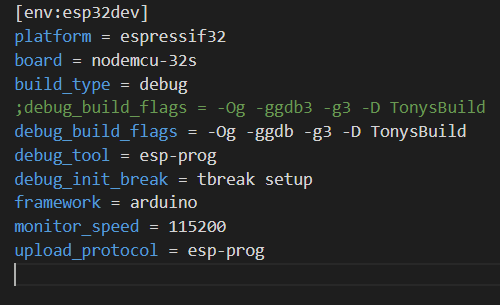
I changed my platformio.ini as below and the helloworld program debugs pretty well. It still hickups when I step over the last command in the main loop, breaks in internal code, but I can single step out back to my code.
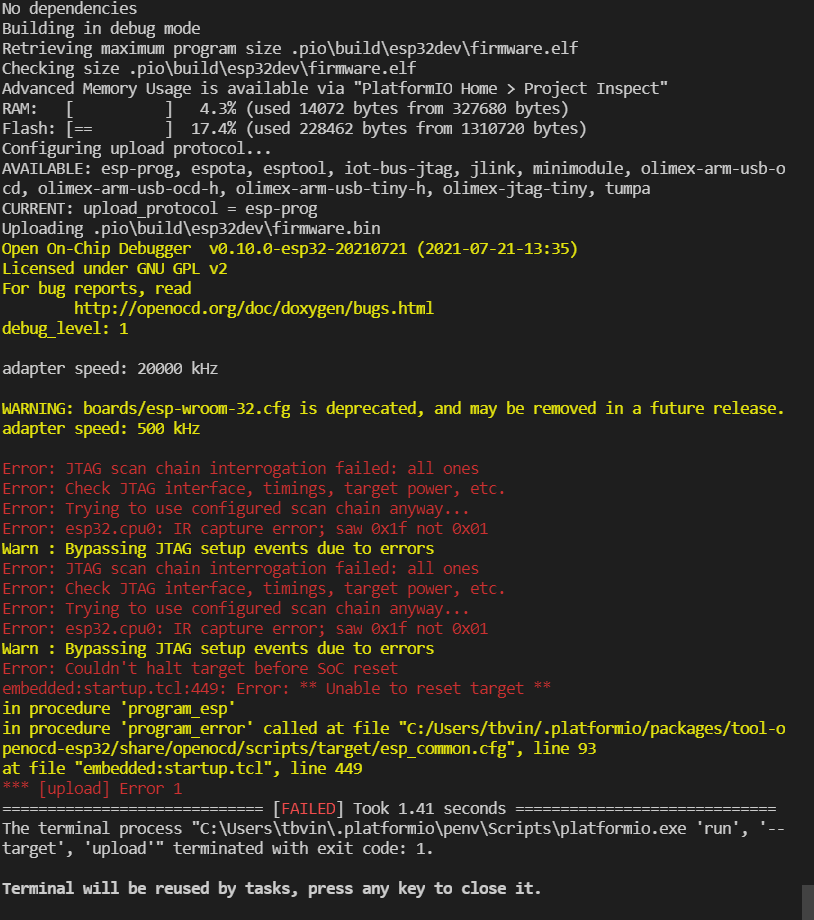
So I optimistally went back to my real project with the same settings in platformio.ini.
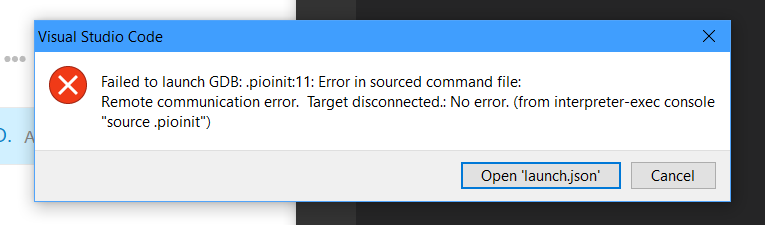
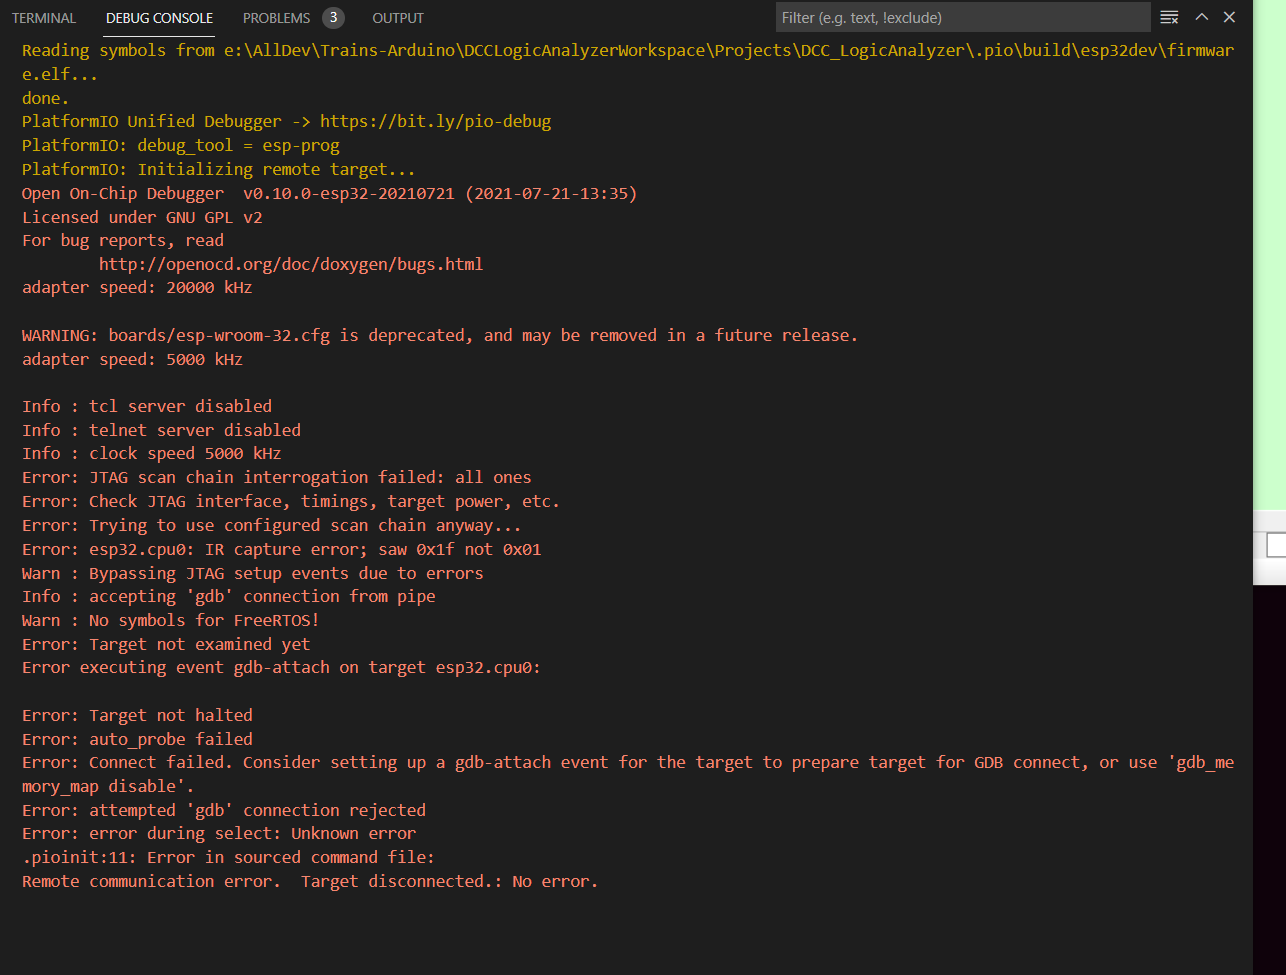
However the JTAG fails. Same hardware is OK on helloworld. I tried with and without setting the JTAG speed to 500. Here is the end part of the terminal listing… Any Ideas?
The short answer is a “meek” mahybee?
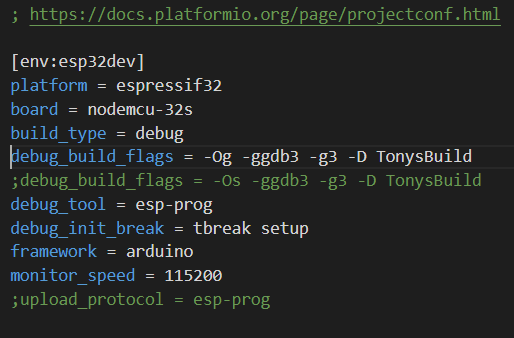
Here is the longer answer… Some of the times that I thought I was doing a JTAG upload it was actually a serial upload. But here is what I can demonstrate: This code builds and uploads on COM5 and I can debug. I had to make one change to the plattformio.ini, the comment out change below.
The program debugs with the INI as shown. But if the -Os line is uncommented, it starts the debugger but does not step properly, only runs two lines and loops back. (the n++ and Serial.println )
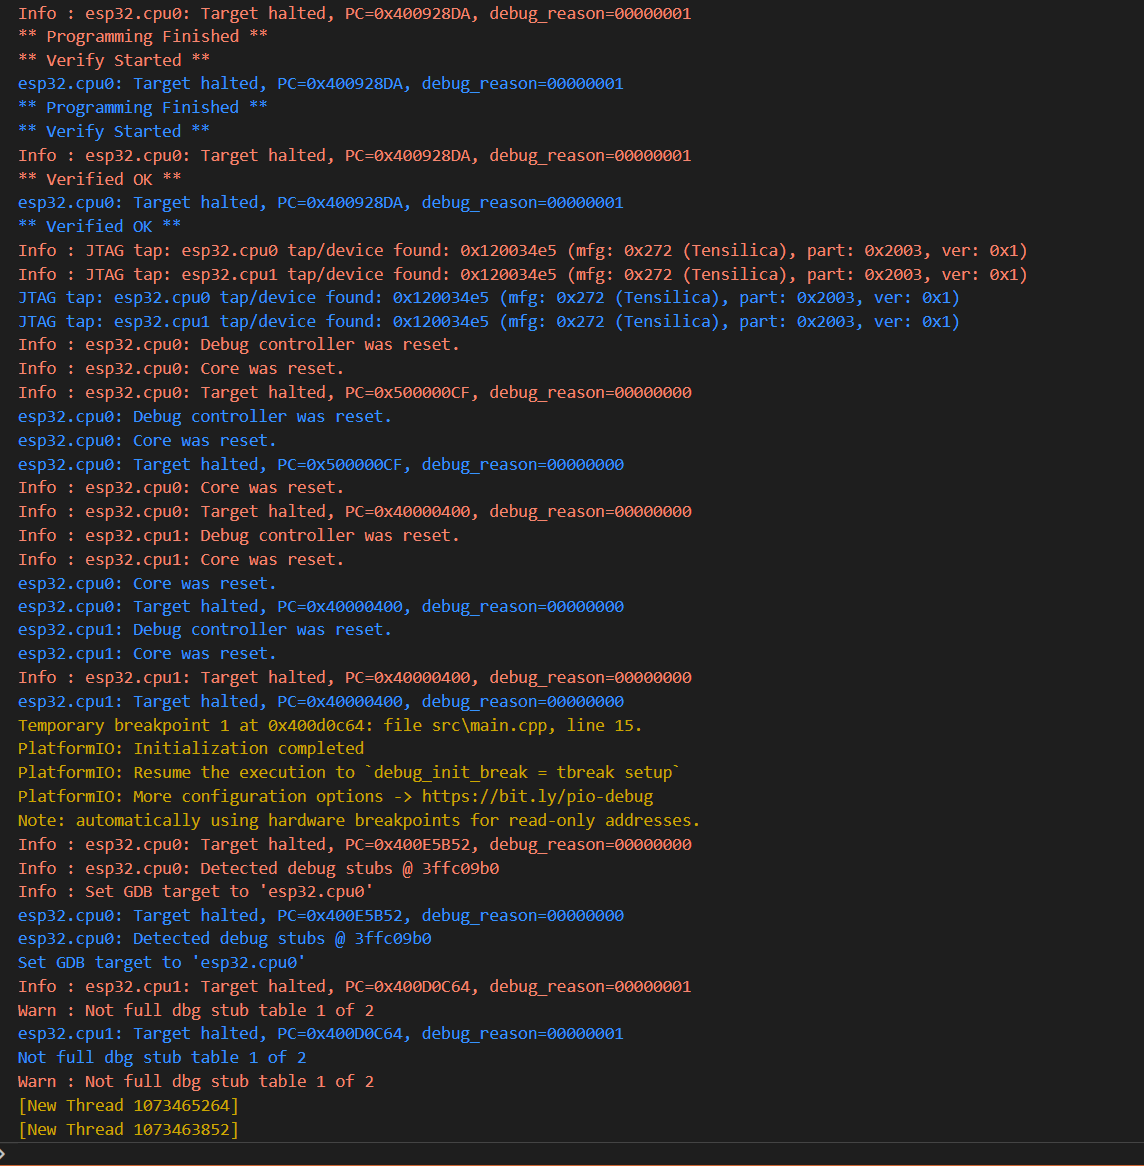
Here is the terminal when the working debug starts. ( there are a lot of lines before this snip and a few after but hopefully this conveys the info. I will show similar with my real code in a second email.
When I first loaded the workspace and the real project, I built and ran the debugger and it started! I pressed the resume button and nothing happened for 5 minutes so I stopped debugging and tried again. That is where the above captures come from. ( maybe the board still had the test project running and I was not really debugging my real code? )
This has been flakey! Some due to me learning, but some?
I had pin 13 programmed as an output and it was interfering with the JTAG.
Cautiously optimistic that it is working… I ran to a break point and stepped a couple of times.
Sorry for all the trouble, but even worse, I will probably cause more!