I get this error when starting the debugger. I’m using the Espressif esp_prog as the debugger interface. I’m also using it as the communications interface since the on-board USB port isn’t working.
Here’s the.ini file:
Error message:
undefinedOpen On-Chip Debugger v0.11.0-esp32-20220411 (2022-04-11-08:48)Licensed under GNU GPL v2
For bug reports, read http://openocd.org/doc/doxygen/bugs.html
adapter speed: 20000 kHz
DEPRECATED! use ‘adapter speed’ not ‘adapter_khz’
adapter speed: 5000 kHz
Info : Listening on port 6666 for tcl connections
Info : Listening on port 4444 for telnet connections
Error: libusb_open() failed with LIBUSB_ERROR_NOT_FOUND
Error: no device found
Error: unable to open ftdi device with vid 0403, pid 6010, description ‘', serial '’ at bus location ‘’
Error: no device found
Error: unable to open ftdi device with vid 0403, pid 6014, description '’, serial ‘’ at bus location '’
C:\Users\robgo.platformio\packages\toolchain-riscv32-esp\bin\riscv32-esp-elf-gdb.exe: warning: Couldn’t determine a path for the index cache directory.
Reading symbols from c:\Users\robgo\OneDrive\Documents\PlatformIO\Projects\230306-194856-esp32-c3-devkitm-1.pio\build\esp32-c3-devkitm-1\firmware.elf…
PlatformIO Unified Debugger → Redirecting...
PlatformIO: debug_tool = esp-prog
PlatformIO: Initializing remote target…
.pioinit:11: Error in sourced command file:
COM10: No such file or directory.
Thanks for responding. I have the libusb-win32 (v1.2.7.3) driver installed for Dual RS232 +HS (Interface 0). I get the same error message. I’m using a 64-bit Widows desktop.
Doesn’t matter which driver I use. I get this error in the debugger console:
Info : tcl server disabled
Info : telnet server disabled
Error: libusb_open() failed with LIBUSB_ERROR_NOT_SUPPORTED
Error: libusb_open() failed with LIBUSB_ERROR_NOT_FOUND
Error: no device found
Error: unable to open ftdi device with vid 0403, pid 6010, description ‘', serial '’ at bus location ‘*’
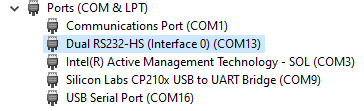
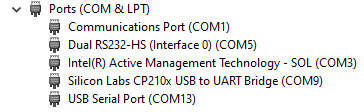
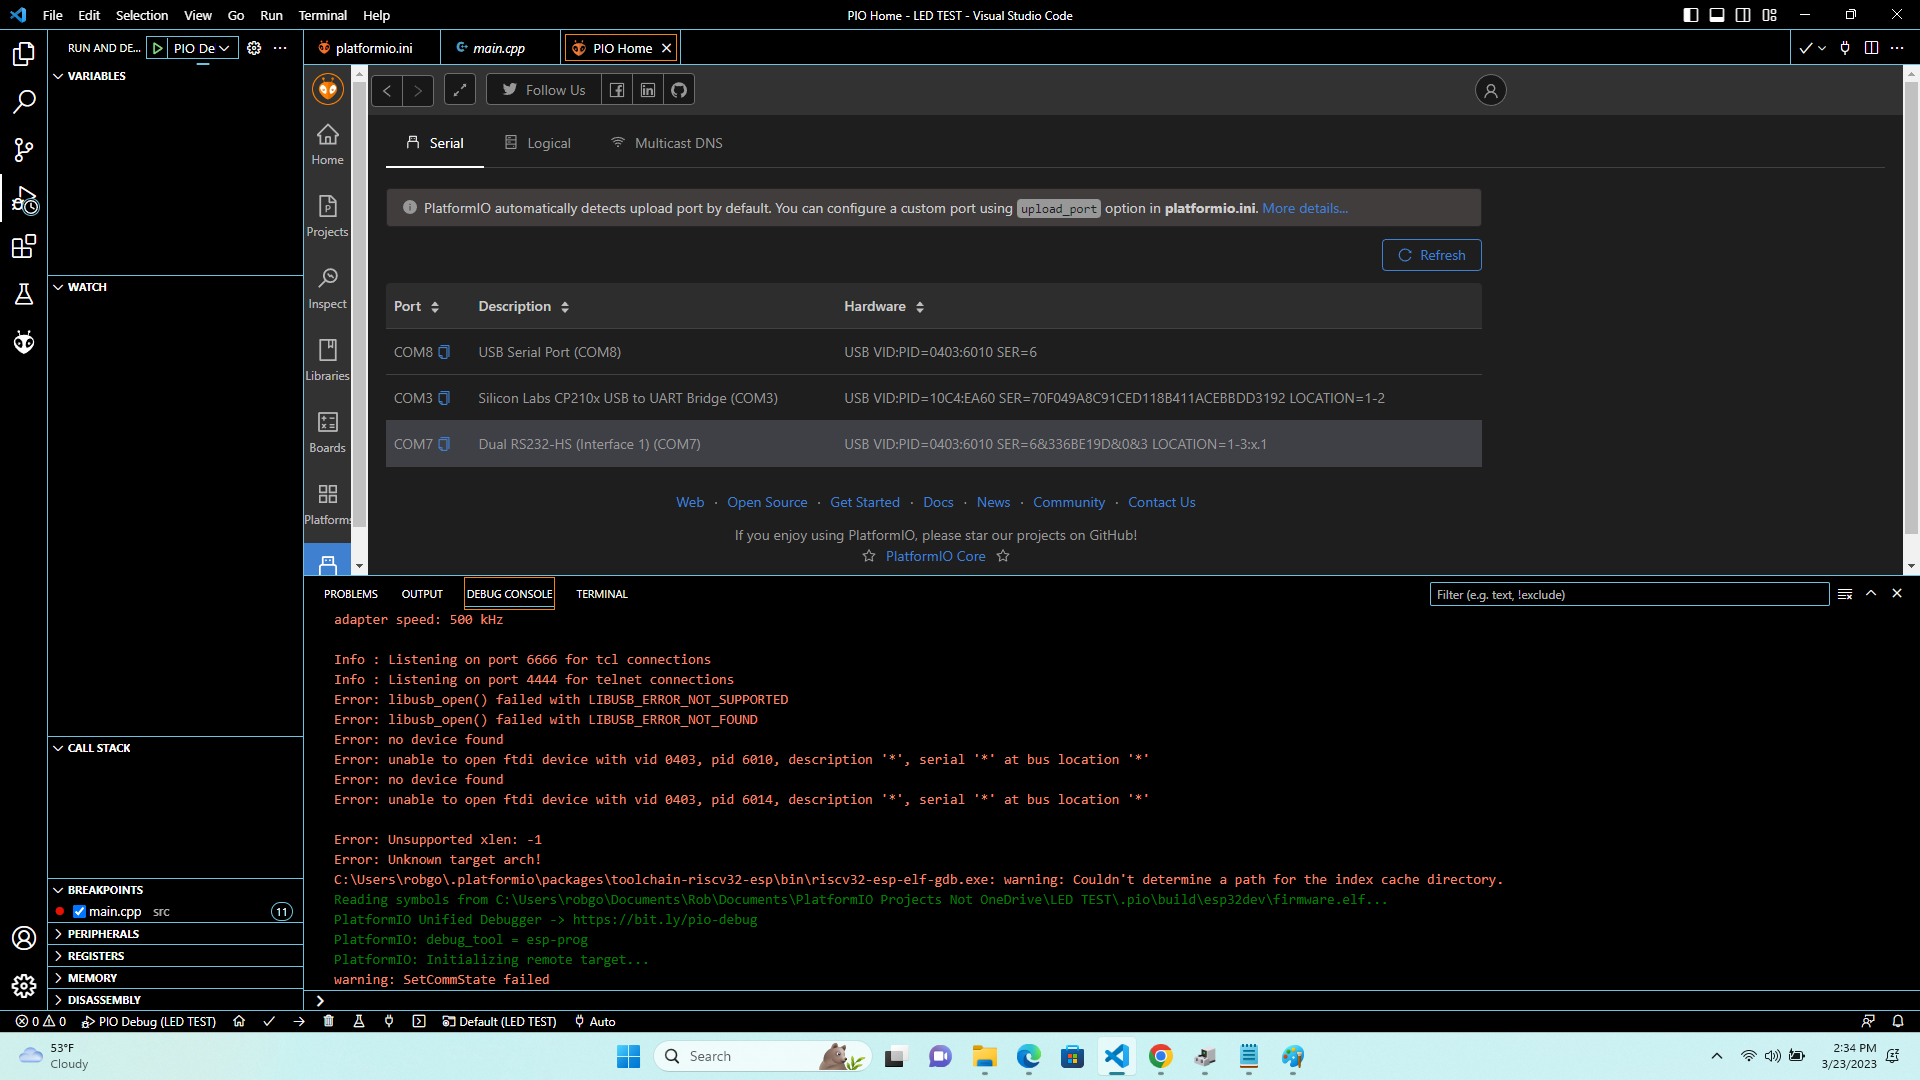
The ports look like this.
COM9 goes straight to the target on-board USB port.
I then connected the esp32-prog to a USB port and Device Manager showed “Dual RS-232-HS (Interface 0) (COM5) & USB Serial Port (COM13)”
I then connected the target board’s (ESP32-C3-DevKit-1) built in USB port and Device Manager showed "Silicon Labs CP210x USB to UART Bridge (COM9).
RUN >START DEBUGGING
(End of`Terminal Output:)
LDF: Library Dependency Finder → Library Dependency Finder (LDF) — PlatformIO latest documentation
LDF Modes: Finder ~ chain, Compatibility ~ soft
Found 31 compatible libraries
Scanning dependencies…
No dependencies
Building in debug mode
Retrieving maximum program size .pio\build\esp32dev\firmware.elf
Checking size .pio\build\esp32dev\firmware.elf
Advanced Memory Usage is available via “PlatformIO Home > Project Inspect”
RAM: [ ] 2.9% (used 9368 bytes from 327680 bytes)
Flash: [= ] 14.8% (used 193366 bytes from 1310720 bytes)
================================================== [SUCCESS] Took 5.31 seconds ==================================================
When I start the debugger I get:
(DEBUG CONSOLE)
undefinedC:\Users\robgo.platformio\packages\toolchain-riscv32-esp\bin\riscv32-esp-elf-gdb.exe: warning: Couldn’t determine a path for the index cache directory.
Reading symbols from c:\Users\robgo\OneDrive\Documents\PlatformIO\Projects\LED TEST.pio\build\esp32dev\firmware.elf…
PlatformIO Unified Debugger → Redirecting...
PlatformIO: debug_tool = esp-prog
PlatformIO: Initializing remote target…
Open On-Chip Debugger v0.11.0-esp32-20220411 (2022-04-11-08:48)
Licensed under GNU GPL v2
For bug reports, read OpenOCD: Bug Reporting
adapter speed: 20000 kHz
DEPRECATED! use ‘adapter speed’ not ‘adapter_khz’
adapter speed: 5000 kHz
Info : tcl server disabled
Info : telnet server disabled
Error: libusb_open() failed with LIBUSB_ERROR_NOT_SUPPORTED
Error: libusb_open() failed with LIBUSB_ERROR_NOT_FOUND
Error: no device found
Error: unable to open ftdi device with vid 0403, pid 6010, description ‘', serial '’ at bus location ‘’
Error: no device found
Error: unable to open ftdi device with vid 0403, pid 6014, description '’, serial ‘’ at bus location '’
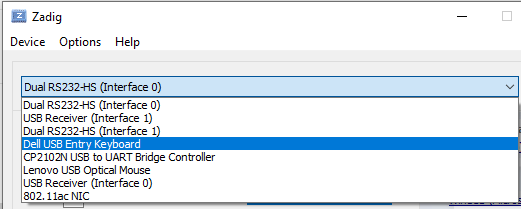
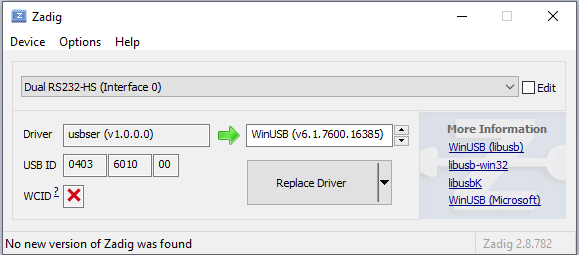
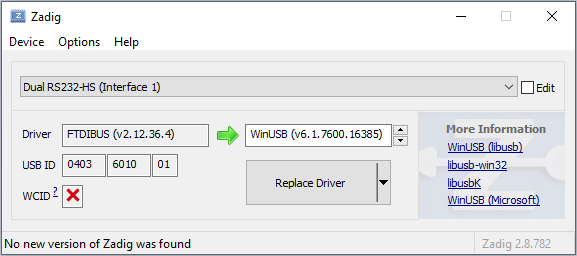
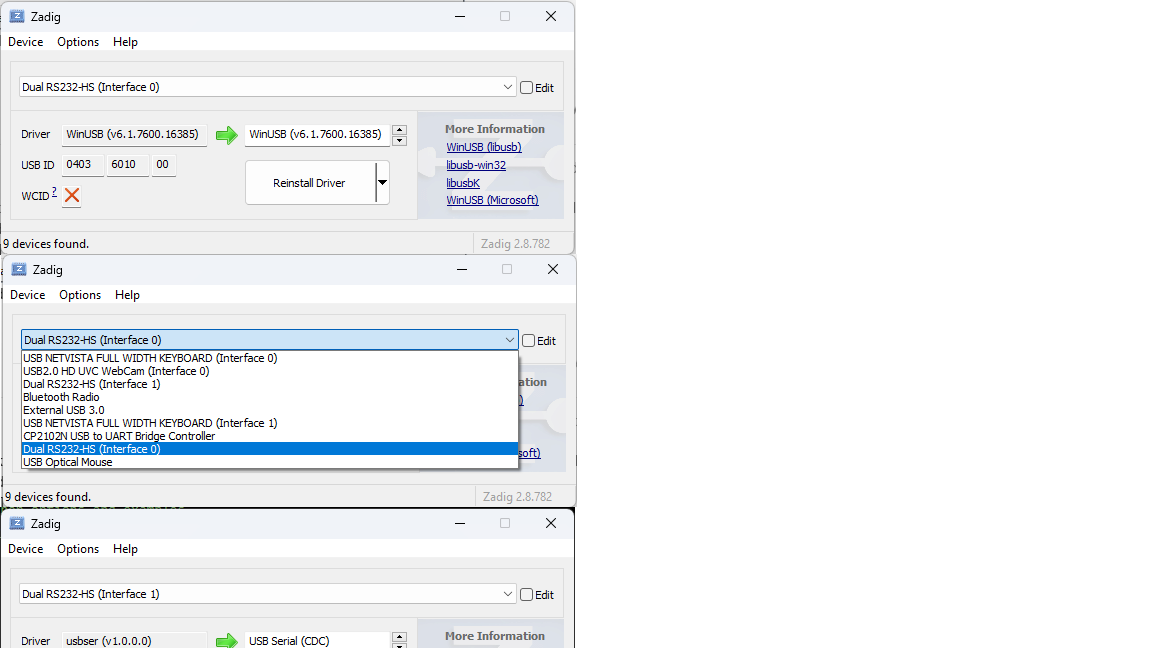
This doesn’t look right at all. Per the article linked above You should WinUSB drivers on Interface 0, and Inteface 1 should have usbser (serial port) drivers installed. Instead you have usbserv on Interface 0 and the native FTDI drivers (FTDIBUS) on Interface 1. Try to use “Replace Driver” as needed in Zadig.
I’ve tried another ESP-PROG board and a different computer and I get the same results.
Here’s the debug console output:
undefinedC:\Users\rxbgx.platformio\packages\toolchain-riscv32-esp\bin\riscv32-esp-elf-gdb.exe: warning: Couldn’t determine a path for the index cache directory.
Reading symbols from C:\Users\robgo\OneDrive\Documents\PlatformIO\Projects\LED TEST.pio\build\esp32dev\firmware.elf…
PlatformIO Unified Debugger → Redirecting...
PlatformIO: debug_tool = esp-prog
PlatformIO: Initializing remote target…
Open On-Chip Debugger v0.11.0-esp32-20220706 (2022-07-06-15:48)
Licensed under GNU GPL v2
For bug reports, read OpenOCD: Bug Reporting
adapter speed: 20000 kHz
adapter speed: 5000 kHz
Info : tcl server disabled
Info : telnet server disabled
Info : clock speed 5000 kHz
Error: JTAG scan chain interrogation failed: all zeroes
Error: Check JTAG interface, timings, target power, etc.
Error: Trying to use configured scan chain anyway…
Error: esp32c3.cpu: IR capture error; saw 0x00 not 0x01
Warn : Bypassing JTAG setup events due to errors
Error: dtmcontrol is 0. Check JTAG connectivity/board power.
Warn : target esp32c3 examination failed
Info : starting gdb server for esp32c3 on pipe
Info : accepting ‘gdb’ connection from pipe
Error: Target not examined yet
Error executing event gdb-attach on target esp32c3:
Warn : No symbols for FreeRTOS!
Error: Target not halted
Error: auto_probe failed
Error: Connect failed. Consider setting up a gdb-attach event for the target to prepare target for GDB connect, or use ‘gdb_memory_map disable’.
Error: attempted ‘gdb’ connection rejected
Error: error during select: Unknown error
.pioinit:11: Error in sourced command file:
Remote communication error. Target disconnected.: Success.
The result of “not working” may be the same but this is fundamentally different to all the last previously shown output. It has now found the adapter and tried to speak to the ESP32C3, but failed to do so.
Add debug_speed = 500 into the platformio.ini to reduce the JTAG clock to a more stable one
Double check that the target is independently powered, aka via a e.g. own USB cable, not via the ESP-PROG
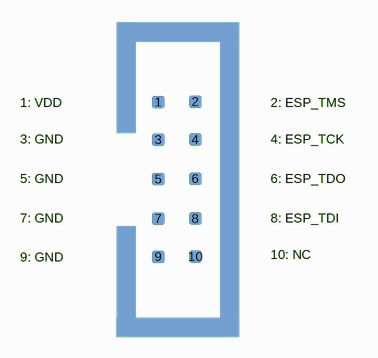
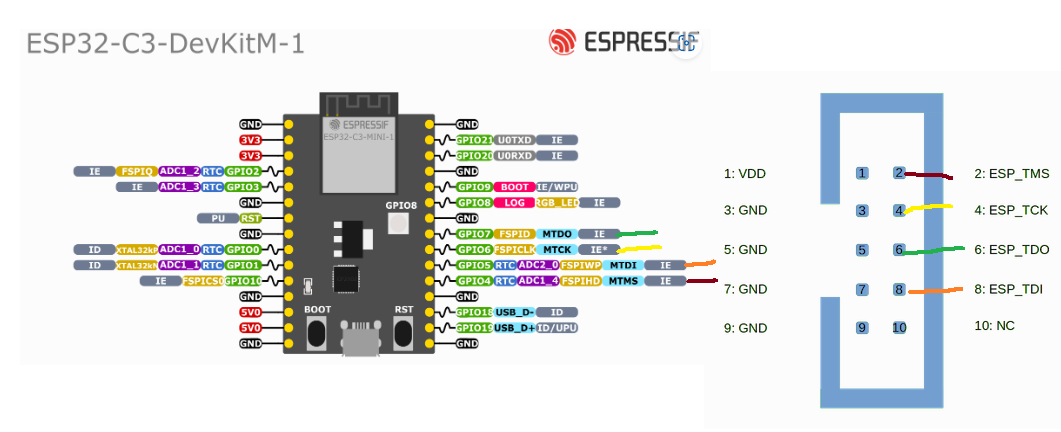
Double check from the ESP32C3 datasheet that you’re connecting the ESP-PROG to the correct JTAG pins. They may differ from the ESP32’s shown in the article above.
Target is powered through it’s own USB connection. I changed the debug speed to 500 and it did go into debug mode briefly before disconnecting. I then tried changing the speed, first to 200, then 100 but it wouldn’t connect. I went back to 500 but still no connection.
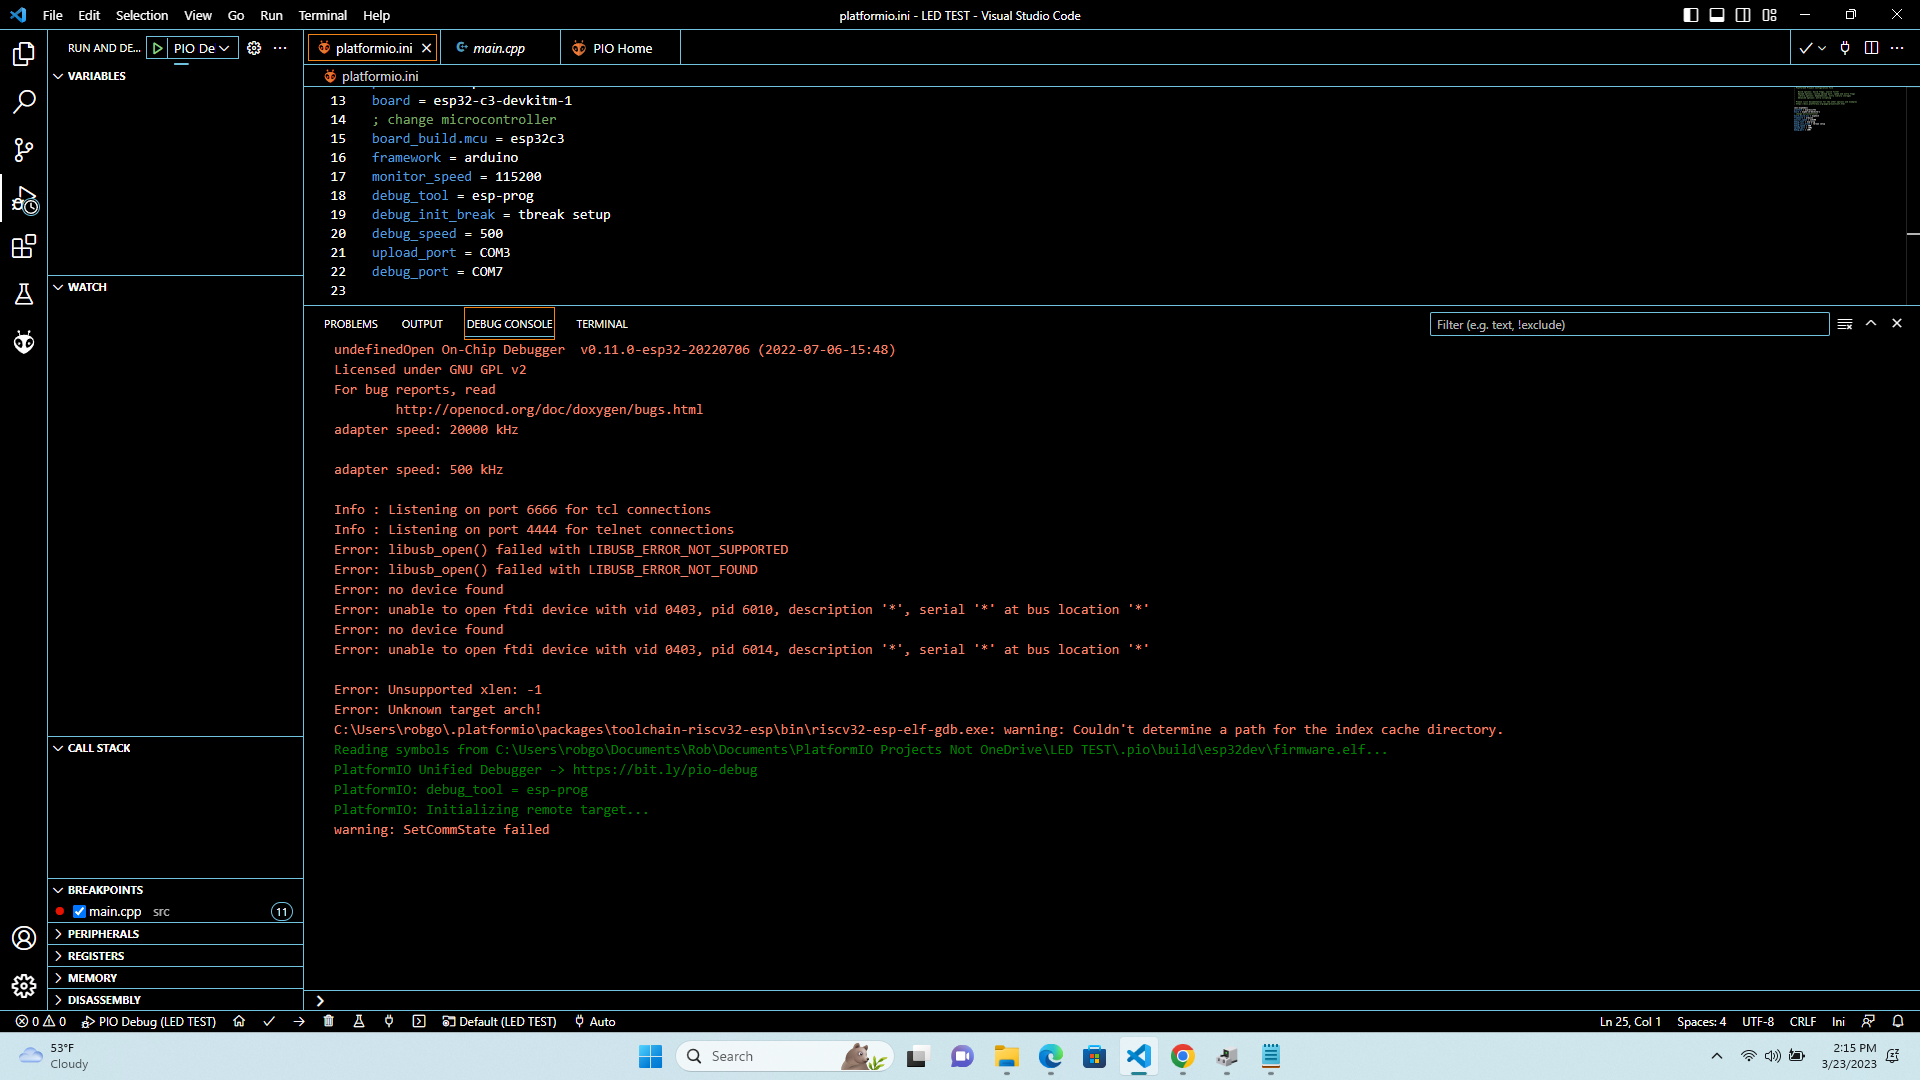
undefinedC:\Users\robgo.platformio\packages\toolchain-riscv32-esp\bin\riscv32-esp-elf-gdb.exe: warning: Couldn’t determine a path for the index cache directory.
Reading symbols from C:\Users\robgo\OneDrive\Documents\PlatformIO\Projects\LED TEST.pio\build\esp32dev\firmware.elf…
PlatformIO Unified Debugger → Redirecting...
PlatformIO: debug_tool = esp-prog
PlatformIO: Initializing remote target…
Open On-Chip Debugger v0.11.0-esp32-20220706 (2022-07-06-15:48)
Licensed under GNU GPL v2
For bug reports, read OpenOCD: Bug Reporting
adapter speed: 20000 kHz
adapter speed: 500 kHz
Info : tcl server disabled
Info : telnet server disabled
Error: failed to reset FTDI device: LIBUSB_ERROR_PIPE
Error: unable to open ftdi device with vid 0403, pid 6010, description ‘', serial '’ at bus location ‘’
Error: no device found
Error: unable to open ftdi device with vid 0403, pid 6014, description '’, serial ‘’ at bus location '’
Error: Unsupported xlen: -1
Error: Unknown target arch!
.pioinit:11: Error in sourced command file:
Remote communication error. Target disconnected.: Success.
At this point I’ve tried 3 different ESP-Prog boards, two ESP32-3C-DevkitM-1 boards, multiple USB cables, board-to-board wires and two computers (Windows 10 desktop and a Windows 11 laptop) so it would seem unlikely that its hardware related. The laptop also a fresh install of PlatformIO.
I’ve seen many posts where using OneDrive was a death sentence and weirdly interact with build systems. Though I don’t see a smoking gun as to this being a problem here, better play it safe and move the project to a non-OneDrive folder.
When I specify the debug port it looks like the debugger is running but it really just hangs. If I don’t specify the upload_ port it tries to use COM8. So I spec COM3 as the upload_port and COM7 as the dbug_port.
debug_port should not be specified at all, especially not as a COM port in your case. The debug port is the argument to GDB’s target remote <debug_port> command and automatically correctly points to 127.0.0.1:3333, which is where OpenOCD, if it can connect successfully, will open the GDB server at. The debug port is not a COM port. Even to GDB, the FTDI adapter appears as a libusb device, it does not interact with it as if it were a serial port.
The only cases in which debug_port can be COM port is when there’s a GDB serial stub running on the target device (i.e. the serial port transports the GDB packets directly to a GDB server opened on the target) or for the BlackMagicProbe. Both do not apply here.