Hi everyone, i have manage to follow up all the required steps to upload and debug with esp-prog in platformIO on VSC with a simple blink test code in a ESP-WROOM-32 chip. Here it works flawlessly ( i can modify global variables, create breakpoints, etc).
Debug is a necessary step i need to achieve.
The problem starts when i try to debug another code. It flawlessly compiles and uploads. I can see it working and interact as normal.
but when i run the debug it wont work as well.
One window pop up after the upload:
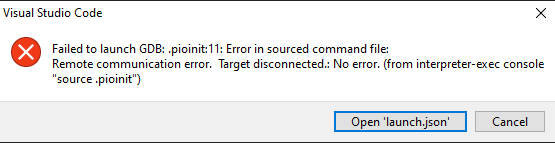
Failed to launch GBD: .pioinit:11: Error in sourced command file: Remote communication error. Target disconnected.:No error
and the debugger console shows:
Reading symbols from D:\Documents\\Firmware\.pio\build\esp32dev\firmware.elf...
done.
PlatformIO Unified Debugger -> http://bit.ly/pio-debug
PlatformIO: debug_tool = esp-prog
PlatformIO: Initializing remote target...
Open On-Chip Debugger  v0.10.0-esp32-20210401 (2021-04-01-15:46)
Licensed under GNU GPL v2
For bug reports, read
	http://openocd.org/doc/doxygen/bugs.html
adapter speed: 20000 kHz

WARNING: boards/esp-wroom-32.cfg is deprecated, and may be removed in a future release.
adapter speed: 200 kHz

Info : tcl server disabled
Info : telnet server disabled
2
Error: libusb_open() failed with LIBUSB_ERROR_NOT_SUPPORTED
Info : clock speed 200 kHz
Error: JTAG scan chain interrogation failed: all zeroes
Error: Check JTAG interface, timings, target power, etc.
Error: Trying to use configured scan chain anyway...
Error: esp32.cpu0: IR capture error; saw 0x00 not 0x01
Warn : Bypassing JTAG setup events due to errors
Info : accepting 'gdb' connection from pipe
Warn : No symbols for FreeRTOS!
Error: Target not examined yet
Error executing event gdb-attach on target esp32.cpu0:

Error: Target not halted
Error: auto_probe failed
Error: Connect failed. Consider setting up a gdb-attach event for the target to prepare target for GDB connect, or use 'gdb_memory_map disable'.
Error: attempted 'gdb' connection rejected
Error: error during select: Unknown error
.pioinit:11: Error in sourced command file:
Remote communication error.  Target disconnected.: No error.
I have tried to update the GDB openocd, PlatformIO and VSC. also decreased the debugger speed down to 200 but stills not working.
what can be a possible reason to this?
what can i do to solve this problem?
PlatformIO.ini ![]()
[env:esp32dev]
platform = GitHub - platformio/platform-espressif32: Espressif 32: development platform for PlatformIO // as recommended to use the last version
board = esp32dev
framework = arduino
monitor_speed=115200
upload_speed = 115200
;JTAG firmware upload and debug
debug_tool = esp-prog
upload_protocol = esp-prog
upload_port = COM5
debug_init_break = tbreak setup
debug_speed = 200 // 500 or commented is the same
Thanks in advance, best regards.
Jim
*[EDIT] to add that i have tried in another PC and the results are the same ![]()