I tried to figure out how to show the memory with a given length and address when both the address and length are variables of my code. It’s easy in gdb using a sequence like e.g: x/105hx by to show 105 hex formatted bytes of the memory pointed by ‘by’. Is it possible to get the same result by entering the pointer ‘by’ and length in the Memory field of the debugger.
I couldn’t figure out. Any help or a final ‘it’s imposible’ would be great.
Hello Sivar, hello Max, you are right. It works perfectly using the debug console (CLI). Usually I use ‘x/ where instead of the address I use a variable that points to the address I want to watch.
But it would be much more comfortabel if the same could be used in the field called MEMORY. It’s usually at the left hand side where also the ‘CALL STACK’, ‘BREAKPONTS’, ’VARIABLES’ ect… is show and can be set.
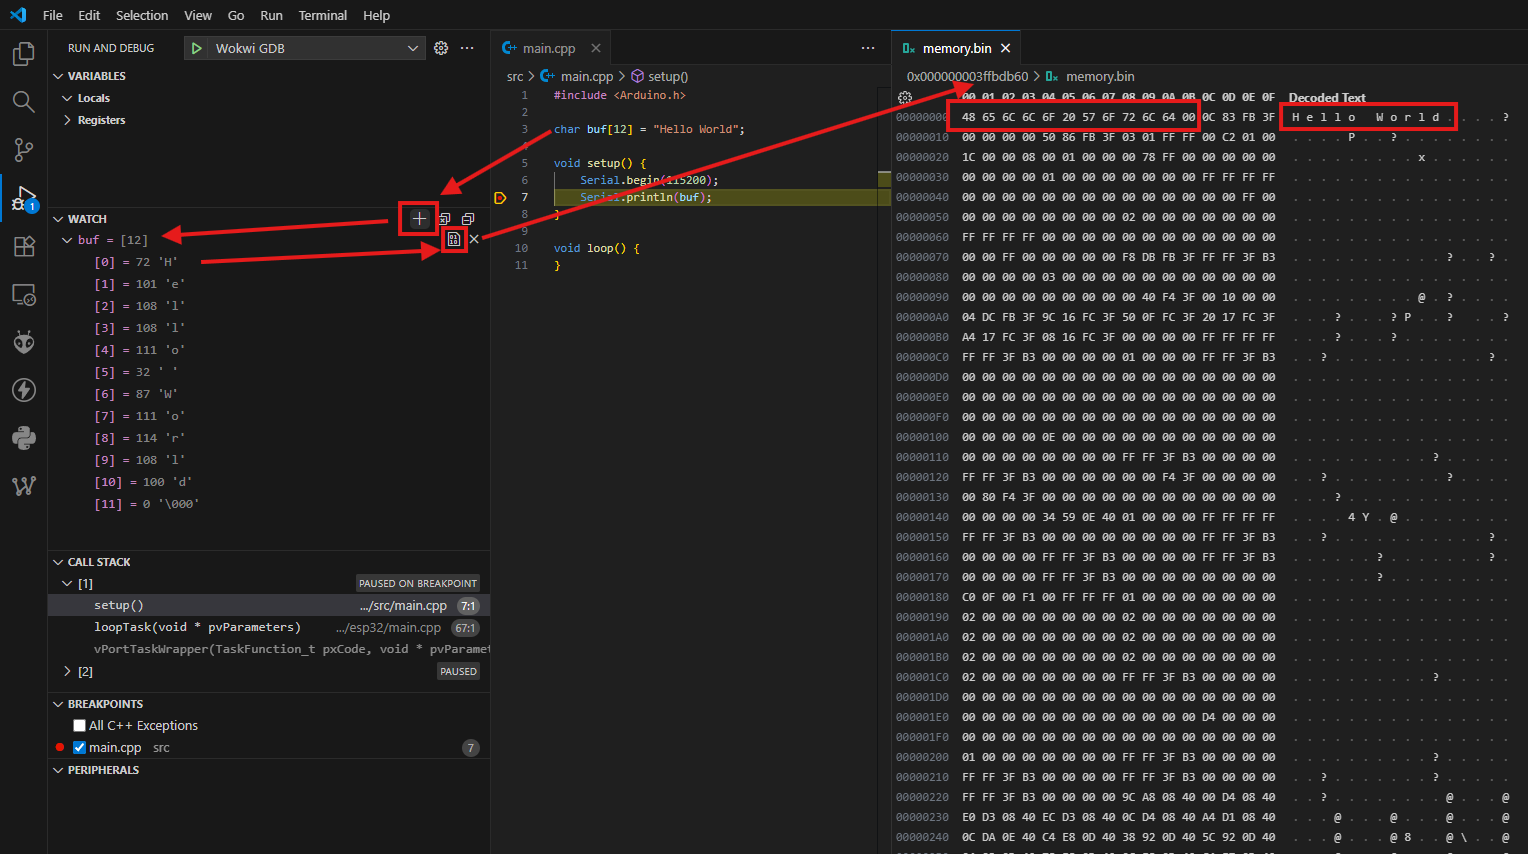
Under ‘MEMORY’ you can set different addresses and lenght and the memory content shows up in an unic window for each address. Unfortunatelly the addresses has to be entered as eg.: 0x80344578 and not as variable names that are part of the code.
Afaik this is more related to VS Code than to PlatformIO.
You need to add the variable to the watched variables. Then hover over the variable with your mouse:
Thank you for the information. What I miss still is if it’s a problem of VS Code or a problem due to my version espresif32 version.
Usualy I only update the version when it’s really mandatory.To often I had problems after an update.