This was tested on NRF52840 but I presume it is unrelated to the board.
When using CLion and a PlatformIO project with custom options the debugger will not start. It will fail with message “Failed to process MI Record”.
How to reproduce:
- In CLion create a new project
- Add debugging through JLink (debug_tool = jlink)
- Verify it works (set a break point somewhere)
- Now add a custom option in platformio.ini (my_custom_option = something)
- Try debugging, it should now failed with message ‘Failed to process MI record’
Example PlatformIO.ini file
[env:nrf52840_dk]
platform = nordicnrf52
board = nrf52840_dk
framework = arduino
debug_tool = jlink
upload_protocol = jlink

my_fine_option = something
In the CLion IDEA logfiles you can see the following:
2021-11-17 13:25:59,148 [103950772] ERROR - brains.cidr.execution.debugger - com.intellij.execution.ExecutionException: Failed to process MI record:


>

<Warning! Ignore unknown configuration option `my_fine_option` in section [env:nrf52840_dk]

com.intellij.execution.ExecutionException: com.intellij.execution.ExecutionException: Failed to process MI record:

>

<Warning! Ignore unknown configuration option `my_fine_option` in section [env:nrf52840_dk]

at com.jetbrains.cidr.execution.ExecutionResult.get(ExecutionResult.java:53)

at com.jetbrains.cidr.execution.ExecutionResult.get(ExecutionResult.java:37)

at com.jetbrains.cidr.execution.debugger.CidrDebugProcess$2.lambda$processWillTerminate$0(CidrDebugProcess.java:233)

at com.jetbrains.cidr.execution.debugger.CidrDebugProcess$VoidDebuggerCommand.call(CidrDebugProcess.java:973)
Either this is in the platformio plugin or in CLion itself - not sure.
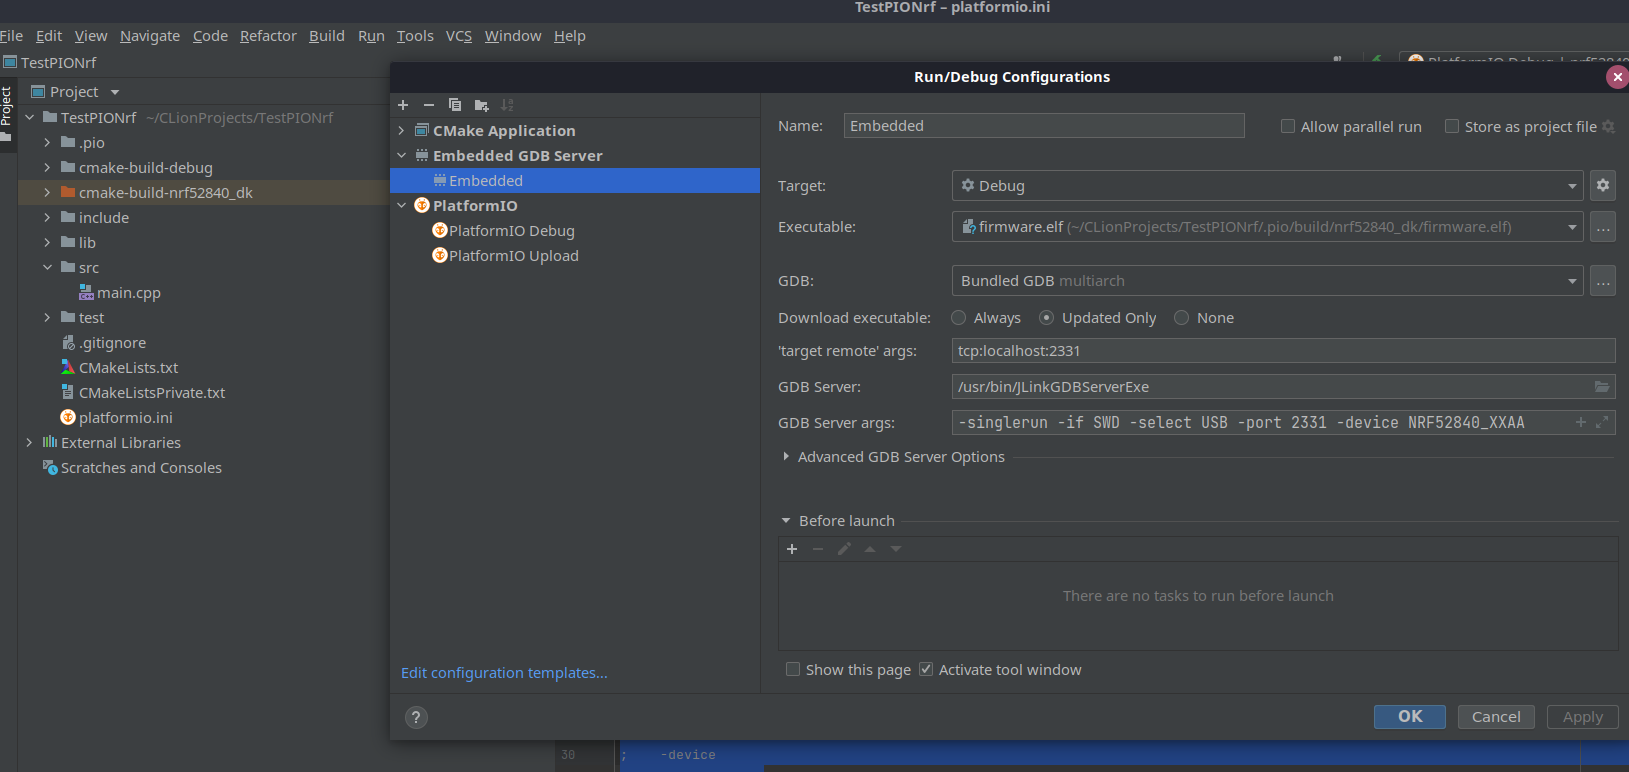
Work around:
Instead of just using debug_tool also specify the debug_server, like this:
debug_server =
    /usr/bin/JLinkGDBServerExe
    -singlerun
    -if
    SWD
    -select
    USB
    -port
    2331
    -device
    NRF52840_XXAA