Can't use the ESP-Prog

I’ve done everything I can to make this Esp-prog work, I’m giving up…

I’ve looked through all the guides, revised the pins several times, but I can’t understand what happens.

This is the output I get…

PlatformIO Unified Debugger → Redirecting...
PlatformIO: debug_tool = esp-prog
PlatformIO: Initializing remote target…
Open On-Chip Debugger v0.10.0-esp32-20210721 (2021-07-21-13:35)
Licensed under GNU GPL v2
For bug reports, read
OpenOCD: Bug Reporting
adapter speed: 20000 kHz

WARNING: boards/esp-wroom-32.cfg is deprecated, and may be removed in a future release.
adapter speed: 5000 kHz

adapter speed: 5000 kHz

Info : tcl server disabled
Info : telnet server disabled
Info : clock speed 5000 kHz
Error: JTAG scan chain interrogation failed: all ones
Error: Check JTAG interface, timings, target power, etc.

Error: Trying to use configured scan chain anyway…

Error: esp32.cpu0: IR capture error; saw 0x1f not 0x01

Warn : Bypassing JTAG setup events due to errors

Info : accepting ‘gdb’ connection from pipe

Warn : No symbols for FreeRTOS!

Error: Target not examined yet

Error executing event gdb-attach on target esp32.cpu0:

Error: Target not halted

Error: auto_probe failed

Error: Connect failed. Consider setting up a gdb-attach event for the target to prepare target for GDB connect, or use ‘gdb_memory_map disable’.

Error: attempted ‘gdb’ connection rejected

Error: error during select: Unknown error

.pioinit:11: Error in sourced command file:

Remote communication error. Target disconnected.: Success.

My platformio.ini

[env:esp32doit-devkit-v1]

platform = espressif32

board = esp32doit-devkit-v1

framework = espidf

upload_port = COM3

debug_tool = esp-prog

debug_init_break = tbreak app_main

And my main.c

void app_main() {}

I already try the blink exemples using arduino and esp-idf frameworks, the error is the same.

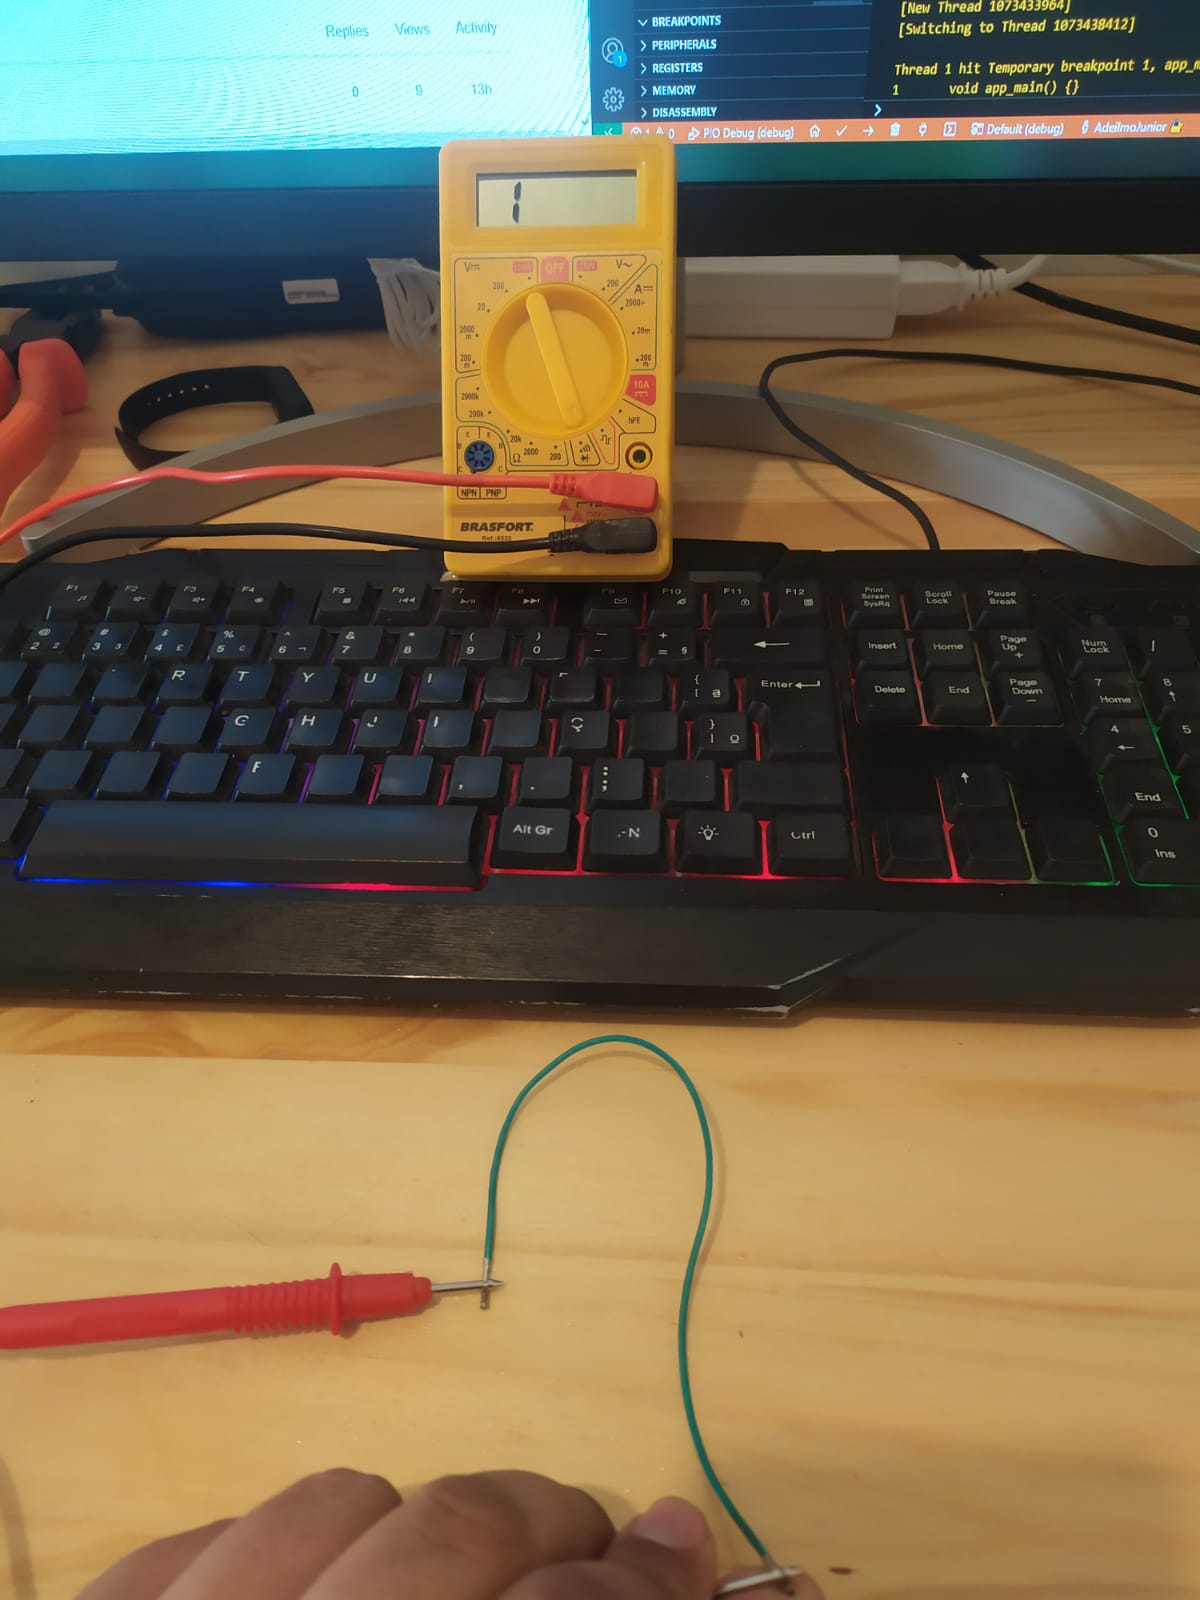
The pin 14 and pin 15 are allways on high.

Tried a lower debug speed? The current 5000 kHz seems fairly high.

debug_speed = 500

no change

PlatformIO Unified Debugger → Redirecting...
PlatformIO: debug_tool = esp-prog
PlatformIO: Initializing remote target…
Open On-Chip Debugger v0.10.0-esp32-20210721 (2021-07-21-13:35)
Licensed under GNU GPL v2
For bug reports, read
OpenOCD: Bug Reporting
adapter speed: 20000 kHz

WARNING: boards/esp-wroom-32.cfg is deprecated, and may be removed in a future release.
adapter speed: 5000 kHz

adapter speed: 500 kHz

Info : tcl server disabled
Info : telnet server disabled
Info : clock speed 500 kHz
Error: JTAG scan chain interrogation failed: all ones
Error: Check JTAG interface, timings, target power, etc.

Error: Trying to use configured scan chain anyway…

Error: esp32.cpu0: IR capture error; saw 0x1f not 0x01

Warn : Bypassing JTAG setup events due to errors

Info : accepting ‘gdb’ connection from pipe

Warn : No symbols for FreeRTOS!

Error: Target not examined yet

Error executing event gdb-attach on target esp32.cpu0:

Error: Target not halted

Error: auto_probe failed

Error: Connect failed. Consider setting up a gdb-attach event for the target to prepare target for GDB connect, or use ‘gdb_memory_map disable’.

Error: attempted ‘gdb’ connection rejected

Error: error during select: Unknown error

.pioinit:11: Error in sourced command file:

Remote communication error. Target disconnected.: Success.

This is a problem in the communication between the ESP-Prog and the ESP32. Possible causes:

  • The wiring is not correct, in particular TMS, TCK, TDI, TDO.
  • The ESP32 board is not properly powered (independent from ESP-Prog)
  • The wiring isn’t making good contact or is too long.
  • The JTAG pins are also wired to and/or configured for other peripherals (e.g. LCD)
  • The ESP32 has firmware that puts it into deep sleep.

Please show a schematic and a photo of how your setup (PC, ESP-Prog, ESP32) looks.

1 Like

After two weeks, and here my problem…
Broken jumper, the best thing is it’s new…

When @manuelbl talked about the wiring not making good contact, I change all the wires and work.

1 Like