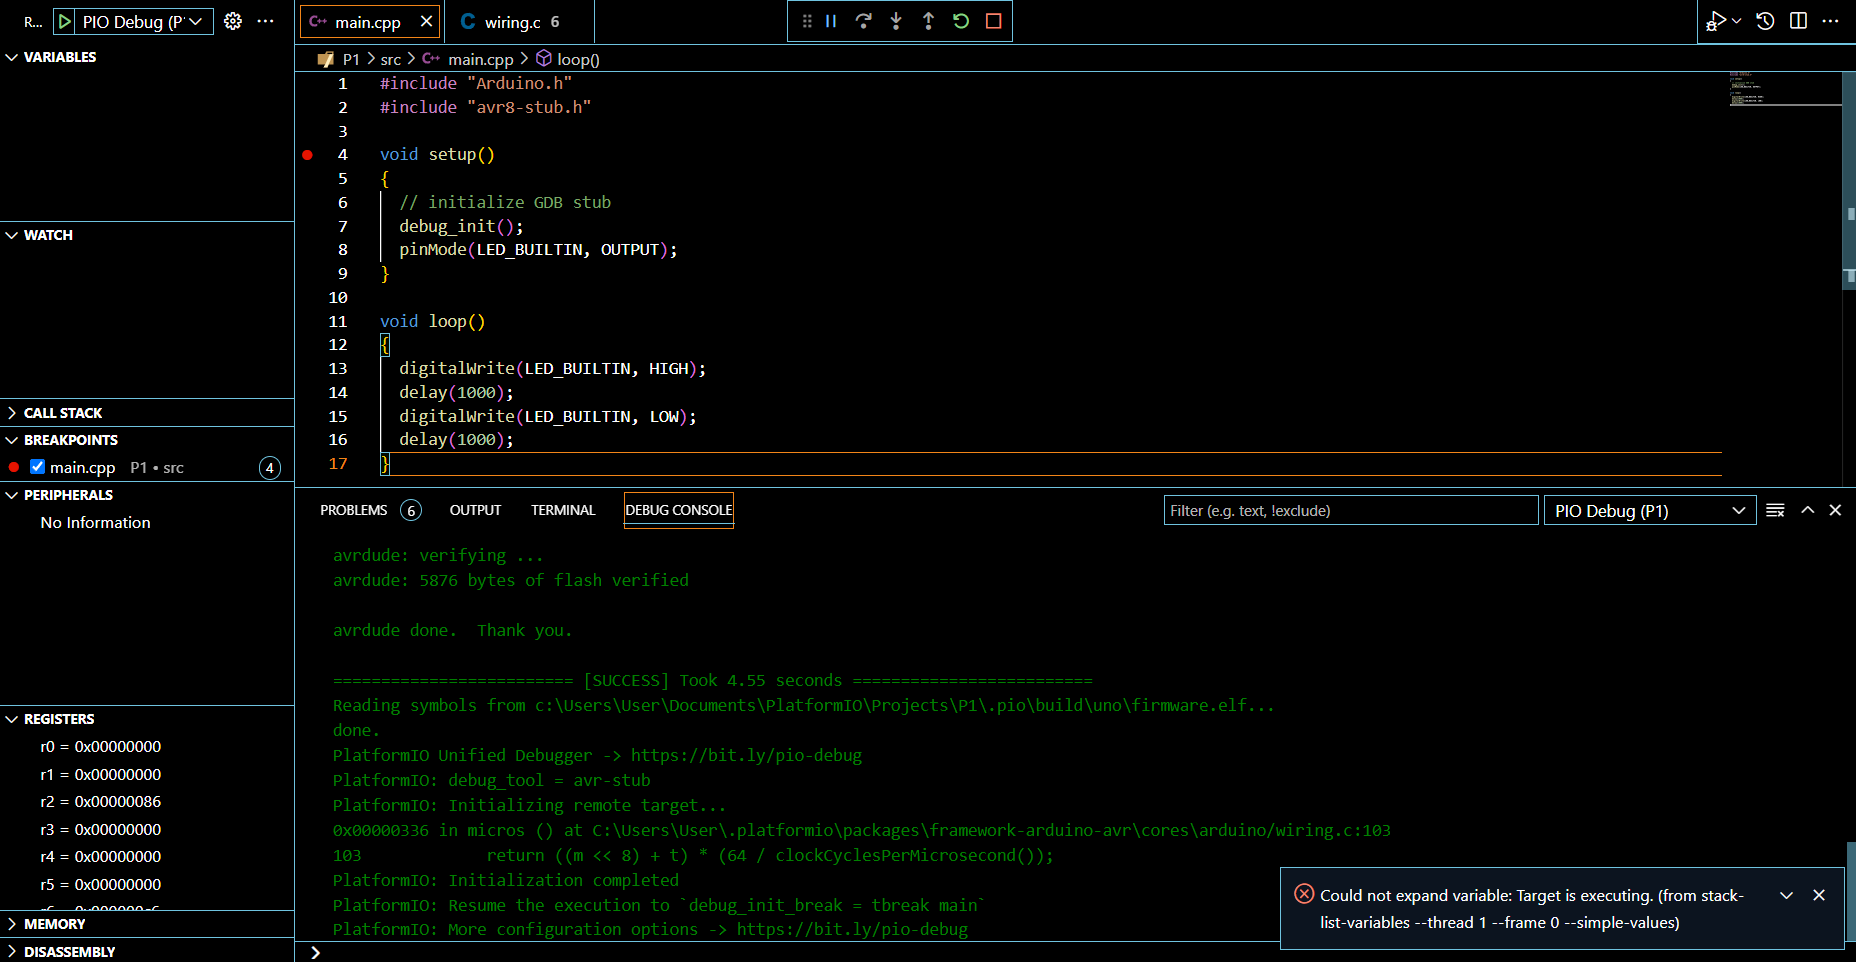
Hello everyone, this is my first time debugging an Arduino UNO. For some reason, after I start debugging, the debug console says everything works well. But I can’t use the Step In and Step Over function. And also, it will produce a wiring.c file, which I don’t know what is this too. Can anyone please help me?
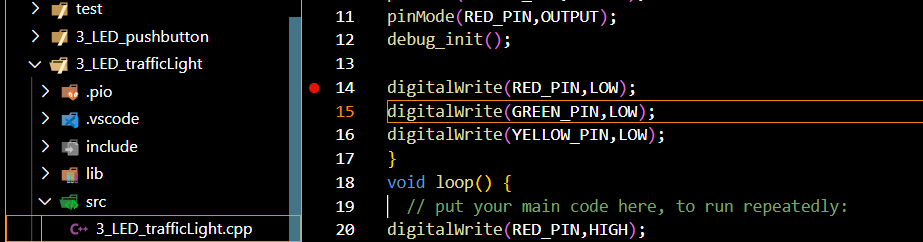
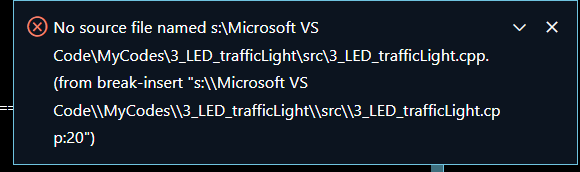
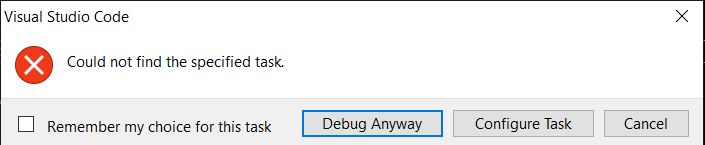
For some reason, I am having this issue again. But this time, it popped up a weird error that says i don’t have that source file in my folder, which I have.
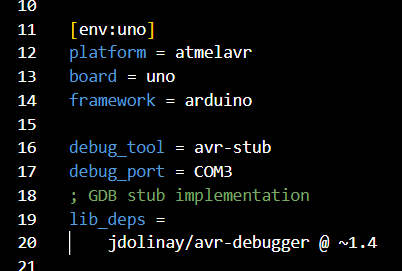
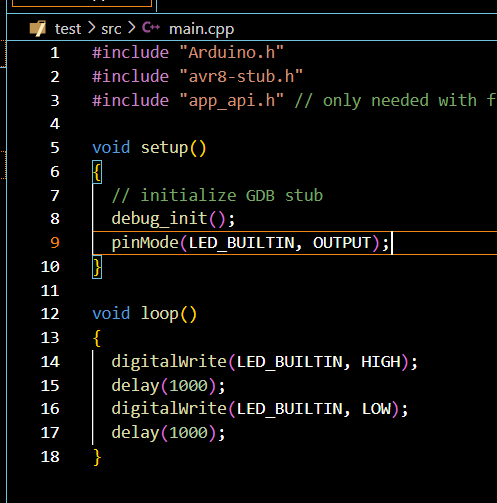
The only problem here I saw is the “//” instead of the “/”. Will this affect anything? Other than that, it’s all correct.
When i try to use this code from the platformIO’s debugging page, it ran well without this error.
I’m going to add some more details. I tried deleting and recreating the project. Apparently, it works fine, until when I create more projects, it starts to pop this error up and redirects the debugger to the breakpoint set in another project file where the debugger had previously run.
I created 2 additional projects to test this.
Let me describe this error in another way. Let’s say I have created projects P1, P2 and P3 (P1 first, P3 last).
The debugger ran well on P2 but shows the error when i tried to run on P1 and P3. While the debugger is active on either P1 and P3, when I proceed to add a breakpoint in P2, the debugger somehow break at that line in P2.
The environment switches seemed to not affect anything whatever that I was debugging. Even though my environment is at P1, it can still run the debugger at P2.
This usally pops up when PlatofrmIO hasn’t yet re-generated the tasks file after switching an environment. Briefly waiting and trying it again might work. Does it consistently not work?
Funny though, my VSCode workspaces contains… a lot of projects and debuger environment always starts in the currently selected one (as selected with the project environment switcher).