I created a (hopefully) highly efficient driver (using DMA) for the well known ST7789-240-240 display modules and a small test/debug application around it.
As long as I set breakpoints in my main.cpp file, debugging works as expected. But when I set a a single breakpoint in my (templated) driver class I get
Cannot insert hardware breakpoint 1.
Could not insert hardware breakpoints:
You may have requested too many hardware breakpoints/watchpoints.
I did:
in platform.py: -d3 -l <path_to_logfile> for openocd, (maybe there another way so set these parameters?)
in platformio.ini: "debug_init_break = " to remove the initial breakpoint
Per Espressif-documented quirks you only have a few breakpoints (2 or 4). Can you remove all other breakpoints before attempting to place one in that method? If the template is screwing with it, maybe you can spealize the template function for the class or types you’re interested in so that it’s only being used by one class where you can breakpoint in?
As declared with the “ststm32” tag, I am not working with espressiv32, but with ststm32 (v 12.0.0; did pio update yesterday). The cpu is STM32F072RB.
As written in my post, I’ve set ONE SINGLE breakpoint. I even removed the default breakpoint at main() with the "debug_init_break = ". According to the reference manual, the CPU should provide four hardware breakpoints.
I use template parameters to define buffer lengths and GPIOs. I use them as a modern and type safe replacement for lines like “#define PIN_RST… #define BUFLEN…”. Imho, specialization is not a proper way to go here. Btw, I use only one single instance of the template and one single instance of the class in my code.
My bad, seeing “Connot insert hardware breakpoint” my mind was immediately on Espressif32 as that’s where it’s mainly occuring.
Try and start debugging again with the normal initial breakpoint. In the “Debug Console” you should be able to type in GDB commands. Per debug c++ template with gdb - Stack Overflow there are break and rbreak commands available. I’m not sure about the syntax, but you can try
Next debugging session
I tried to set the breakpoint to the same location by clicking with the on it in the IDE
—>success; works as expected!
Next debugging session:
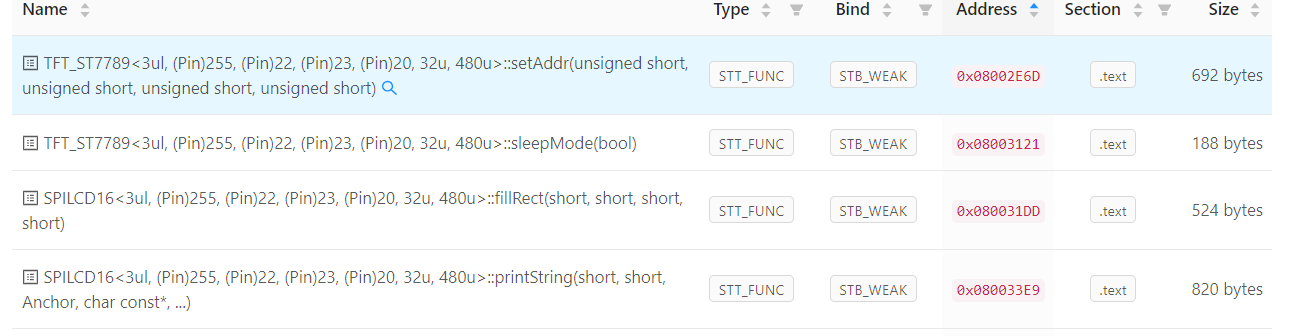
break spilcd16.hpp:330

Breakpoint 2 at 0x800338a: spilcd16.hpp:330. (6 locations)
{"token":21,"outOfBandRecord":[],"resultRecords":{"resultClass":"done","results":[]}}
Warning:
Cannot insert hardware breakpoint 2.
Could not insert hardware breakpoints:
You may have requested too many hardware breakpoints/watchpoints.