Built_type = debug - unexpected behavior?

I tried to build the “blinky2” example from “git clone GitHub - ve3wwg/stm32f103c8t6: libopencm3 and FreeRTOS projects using the STM32F103C8T6 MCU” with “BluePill” and libopencm3.

When the build_type=release in *.ini file, the example is uploaded and works (blinks).
When the build_type=debug, the example is compiled successfully but does not work after uploading (does not blink).
lib_archive = false in both cases.

There is no errors and warning messages giving a hint what may go wrong. When I run a debugger, I see it hitting usart3 blocking handler (?) after enabling interrupts (debugging with faults may be not very accurate):

“The target stopped in HardFault exception state.
Reason: A fault with configurable priority has been escalated to a HardFault exception at 0x08000450.”

In my expectations, the debug version should include the debug references into *.elf file, but should work similarly to release version when uploaded.

If I take a release version and run it under debugger, I see normal behavior.

What could be the reasons for incorrect behavior?

The linked repo is not directly PlatformIO compilable. Can you upload the exact PlatformIO project you’re having problems with?

Maximilian, I modified only one file from yours - (platformio.ini) to add build options. The entire project is here: GitHub - dmderev/Blinky_Platformio_FreeRTOS
I also uninstalled the packages and toolchains from platformio, and reinstalled clean. The effect is the same - build_type = debug results in non-working program.

When run under debugging, this configuration locks in the blocking handler (vectors.c):
void blocking_handler(void)
{
while (1);
}

Apparently, it is the same issue as described here:

Maybe the"lib_archive = false" does not apply in debug mode?

There is also this at the end of compilation:
“arm-none-eabi-gcc-ar rc .pio\build\bluepill_f103c8\libFrameworkLibOpenCM3.a”
or: “Archiving .pio\build\bluepill_f103c8\libFrameworkLibOpenCM3.a”.
However, same is in the release build. I am lost now.

I found the following topic on internet:

When the object files are provided to the linker directly on the commandline, it has no choice but to link them fully. But when the object files are provided wrapped within an archive file, the linker does choose which files to link and which file to leave, depending on what symbols it needs to resolve.

It is a good practice to list the .o files, if any, first on the linker commandline before listing any libraries. There’s a proper order, in general, to list the libraries too.

Jan Belohoubek said:

why are int handlers not removed when linked with “reduced” archive! This is strange …

How are the interrupt/exception handler symbols declared? Are they weak symbols, declared as aliases to a dummy/default handler?

If so, it seems likely that when linking with the full archive file, the linker resolves some handlers, like BusFault_Handler, as the dummy/default handler.

I’ve looked into the issue and what I see is that it calls vTaskStartScheduler();, which at some point calls prvPortStartFirstTask(). The functon does

static void prvPortStartFirstTask( void )
{
	__asm volatile(
					" ldr r0, =0xE000ED08 	\n" /* Use the NVIC offset register to locate the stack. */
					" ldr r0, [r0] 			\n"
					" ldr r0, [r0] 			\n"
					" msr msp, r0			\n" /* Set the msp back to the start of the stack. */
					" cpsie i				\n" /* Globally enable interrupts. */
					" cpsie f				\n"
					" dsb					\n"
					" isb					\n"
					" svc 0					\n" /* System call to start first task. */
					" nop					\n"
				);
}

and the svc 0 call should transport the execution to opencm3.c

void sv_call_handler(void) {
	vPortSVCHandler();
}

which it also does, and it executes the vPortSVCHandler() function all the way to the end, but then just returns back to after the svc 0 line, and I don’t think it’s supposed to do that. Because it will execute the NOP and then garbage instruction code after the function code until it crashes (which happens 2 instructions deep after a garbage write which ends in a hardfault)

x/10i 0x8000424-8
   0x800041c <prvPortStartFirstTask+20>:	ldrh	r7, [r5, #58]	; 0x3a
   0x800041e <prvPortStartFirstTask+22>:	svc	0
   0x8000420 <prvPortStartFirstTask+24>:	nop
   0x8000422:	movs	r0, r0
=> 0x8000424:	stc	0, cr14, [r8, #-0]

so the question is why does that switching not work in debug mode.

I’ve also inspected pxCurrentTCB and the variable seems correct and points at the LED task.

Yes and when I add

debug_build_flags = -O2 -ggdb3

to get debug to build with -O2 optimizations instead of -Og (docs)

I can see that in the function

void vPortSVCHandler( void )
{
	__asm volatile (
					"	ldr	r3, pxCurrentTCBConst2		\n" /* Restore the context. */
					"	ldr r1, [r3]					\n" /* Use pxCurrentTCBConst to get the pxCurrentTCB address. */
					"	ldr r0, [r1]					\n" /* The first item in pxCurrentTCB is the task top of stack. */
					"	ldmia r0!, {r4-r11}				\n" /* Pop the registers that are not automatically saved on exception entry and the critical nesting count. */
					"	msr psp, r0						\n" /* Restore the task stack pointer. */
					"	isb								\n"
					"	mov r0, #0 						\n"
					"	msr	basepri, r0					\n"
					"	orr r14, #0xd					\n"
					"	bx r14							\n"
					"									\n"
					"	.align 4						\n"
					"pxCurrentTCBConst2: .word pxCurrentTCB				\n"
				);
}

the instruction bx r14 (=bx lr) jumps to the entry point of task1().

But this doesn’t happen in debug mode…

Aha! In the debug mode where it does not work, at the point of the bx lr instruction, the lr register is loaded with

lr             0x800040d
	134218765

which maps to

x/10i 0x800040d
   0x800040d <pend_sv_handler+2>:	bl	0x80004d0 <xPortPendSVHandler>

since the backtrace is

bt
#0  0x0800048e in vPortSVCHandler () at src\rtos\port.c:250
#1  0x0800040c in pend_sv_handler () at src\rtos\opencm3.c:20

it becomes clear what’s happening: Due to missing compiler optimizations, the code

void sv_call_handler(void) {
	vPortSVCHandler();
}

is not optimized so that calls to sv_call_handler() are directly remapped to vPortSVCHandler, but instead it executes another branch with link (bl) which messes with the later execution, I think.

Let me see what happens if I directly rename the vPortSVCHandler function to sv_call_handler so that this doesn’t matter…

Yeah that solves the problem.

If I go to src/rtos/port.c and do

/* link directly to interrupt routines */
#define vPortSVCHandler sv_call_handler
#define xPortPendSVHandler pend_sv_handler

and further If I go to src/rtos/opencm3.c and comment out the functions

/*void sv_call_handler(void) {
	vPortSVCHandler();
}

void pend_sv_handler(void) {
	xPortPendSVHandler();
}*/

and re-upload, then everthing works nicely in debug mode ^-^.

The opencm3.c integration file is not safe against compiler optimizations, and it is extremely criticial that these functions are called directly (as it would do with compiler optimizations), and not via C function call.

See PR https://github.com/dmderev/Blinky_Platformio_FreeRTOS/pull/1, this change is also equivalent – it turns optimizations back on but only for those critical interrupt service routines. That’s a less-invasive change.

On second thought maybe do it differently.

Other FreeRTOS implementations do not have this problem in the first case because they directly remap function names to the interrupt service routine names. Have a look at the STM32FreeRTOS integration.

So that is pretty much what I did above there and seems more standard than relying on optimizations. The src/rtos/opencm3.c is just plain wrong and shouldn’t exist, the functions should be directly remapped to be safe against debugging.

See https://github.com/dmderev/Blinky_Platformio_FreeRTOS/pull/2.

Since it is pretty common to use the weak definitions and the same code works with other build tools, it looks that it is more logical to fix it in platformio. Apparently the issue is in the order of the files in the linker command line.
Is there a way to control the order? If not, the *.a files should be last in the list of arguments to let link correctly assign symbols, in platformio *.a is first in the list.
The worst is that the problem comes un-advertised.
I’d categorize it as a bug in platformio scripts?

1 Like

This is not related to weak symbols at all.

Unfortunately, we are not done yet… With the changes you made (in defining the function mappings) the debug and release versions work differently - the blink rate is ~4x higher in release than in debug.
Such difference in behavior is not great as it does not create confidence in tools…

I looked at what is linked as entry points now: in debug mode apparently these are correct freeRTOS routines. In release mode I can see no source, but from disassembly it looks reasonable:


So what does platformio change when build types of debug or release is selected - what could be different and explain such behavior?

I also always see that the archive is created (in both debug and release options):
arm-none-eabi-gcc-ar rc .pio\build\bluepill_f103c8\libFrameworkLibOpenCM3.a

I am wondering why as I specified “lib_archive = false” - per documentation that should eliminate archive creation for libopencm3?

I replaced the toolchain with ARM’s but the behavior is identical…

As expected for this specific code, since debug code is not optimized code… -Og vs -Os makes a lot of difference.

debug_build_flags, by default -Og -g2 -ggdb2, are applied, as opposed to the standard -Os. This produces heavily different and slower microcode. That’s the entire point of optimizing code for debugability vs fast code.

Again, not related to archiving.

It disables it for libraries in lib/ and lib_deps, not for the framework code. That will always be archived.

As expected for this specific code

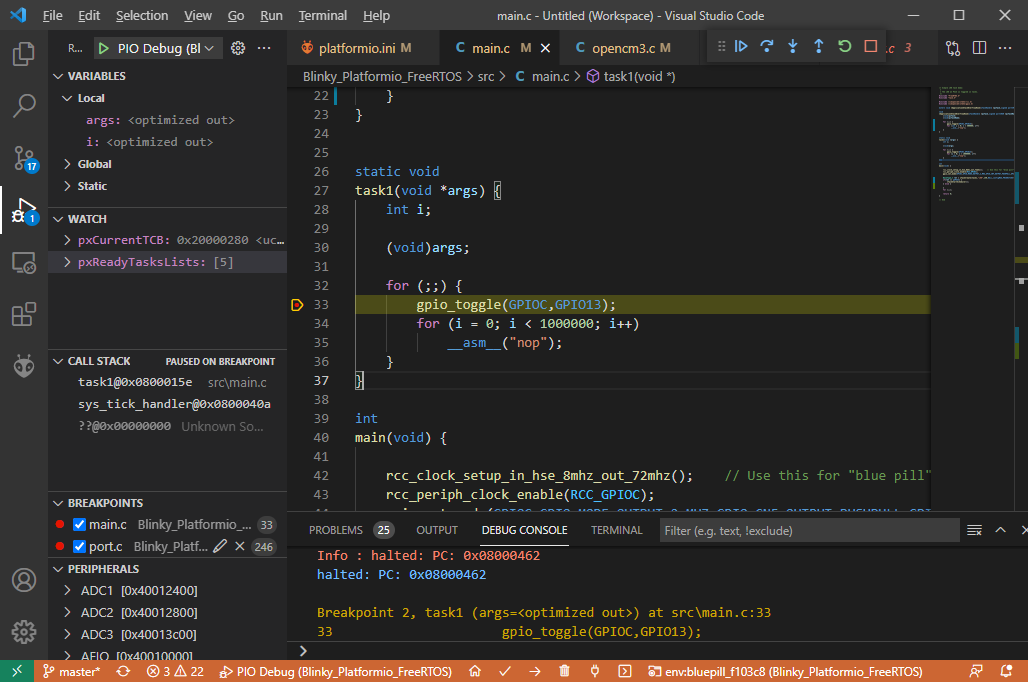
What I mean by this is that if you look at the task code

static void
task1(void *args) {
	int i;

	(void)args;

	for (;;) {
		gpio_toggle(GPIOC,GPIO13);
		for (i = 0; i < 1000000; i++)
			__asm__("nop");
	}
}

the timing is provided by a for loop with a nop inside it. In debug mode with -Og this produces

> C:\Users\Max\.platformio\packages\toolchain-gccarmnoneeabi\bin\arm-none-eabi-objdump.exe -d .\.pio\build\bluepill_f103c8\firmware.elf | grep -A20 "<task1"
08000150 <task1>:
 8000150:       b508            push    {r3, lr}
 8000152:       e004            b.n     800015e <task1+0xe>
 8000154:       bf00            nop
 8000156:       3301            adds    r3, #1
 8000158:       4a04            ldr     r2, [pc, #16]   ; (800016c <task1+0x1c>)
 800015a:       4293            cmp     r3, r2
 800015c:       ddfa            ble.n   8000154 <task1+0x4>
 800015e:       f44f 5100       mov.w   r1, #8192       ; 0x2000
 8000162:       4803            ldr     r0, [pc, #12]   ; (8000170 <task1+0x20>)
 8000164:       f000 fcc6       bl      8000af4 <gpio_toggle>
 8000168:       2300            movs    r3, #0
 800016a:       e7f5            b.n     8000158 <task1+0x8>
 800016c:       000f423f        .word   0x000f423f
 8000170:       40011000        .word   0x40011000

As compared to release mode

08000150 <task1>:
 8000150:       b510            push    {r4, lr}
 8000152:       4c05            ldr     r4, [pc, #20]   ; (8000168 <task1+0x18>)
 8000154:       f44f 5100       mov.w   r1, #8192       ; 0x2000
 8000158:       4620            mov     r0, r4
 800015a:       f000 fc72       bl      8000a42 <gpio_toggle>
 800015e:       4b03            ldr     r3, [pc, #12]   ; (800016c <task1+0x1c>)
 8000160:       bf00            nop
 8000162:       3b01            subs    r3, #1
 8000164:       d1fc            bne.n   8000160 <task1+0x10>
 8000166:       e7f5            b.n     8000154 <task1+0x4>
 8000168:       40011000        .word   0x40011000
 800016c:       000f4240        .word   0x000f4240  ;hex 1,000,000

You can see that the critical part that is executed 1 million times in the debug version is

 8000154:       bf00            nop
 8000156:       3301            adds    r3, #1
 8000158:       4a04            ldr     r2, [pc, #16]   ; (800016c <task1+0x1c>)
 800015a:       4293            cmp     r3, r2
 800015c:       ddfa            ble.n   8000154 <task1+0x4>

which is, nop-ing, adding one to a register (counter), then loading the constant 1000000 value from a location in RAM, comparing those two, and if they’re not equal, jump back to the nop location.

The optimized version does

 800015e:       4b03            ldr     r3, [pc, #12]   ; (800016c <task1+0x1c>)
 8000160:       bf00            nop
 8000162:       3b01            subs    r3, #1
 8000164:       d1fc            bne.n   8000160 <task1+0x10>

this only loads the value 1000000 from flash once into r3, then does a nop, then subtracts one from r3 and checks if it’s 0 (a side effect of the subs instruction is that it sets the not-equal / non-zero flags after the subtraction). So the inner loop only operates on registers and is 3 instructions long (the load instruction ins only executed once), as compared to 5 instructions in every inner loop with a load from Flash (slooow…). So, this will easily be faster in release version than in the debug version.

You can see that the debug version perfoms the blinky as fast as the release version if the compiler is allowed to optimize the loops. Change the function to

#pragma GCC push_options
#pragma GCC optimize ("-Os")
static void
task1(void *args) {
	int i;

	(void)args;

	for (;;) {
		gpio_toggle(GPIOC,GPIO13);
		for (i = 0; i < 1000000; i++)
			__asm__("nop");
	}
}
#pragma GCC pop_options

and upload it in release and debug mode. You will see that the speed is now identical.

Of course, you do not want to rely on nop loops to get the timing right. That’s what you RTOS is for.

You will see that if you write the function simply as

static void
task1(void *args) {
	int i;

	(void)args;

	for (;;) {
		gpio_toggle(GPIOC,GPIO13);
		vTaskDelay(pdMS_TO_TICKS(100));
	}
}

then the FreeRTOS scheduler will put your thread to sleep for 100ms (as provided by the SysTick), and that is pretty immune to code optimization level. Upload it in release and debug mode, and you will observe no perceivable difference between them.

Of course internally, the FreeRTOS functions will be a little bit slower to execute since it’s still unoptimized code in debug mode, but that will now be negligble as not the entire sleep time is stretched by the unoptimized code (as it was in every iteration of the 1,000,000 iterations of the NOP loop before), the timing is provided by the timer.

Ooops, I realized that this example uses program delay as opposed to system time - which I was working on in parallel, and of course this causes the difference. And then I saw your answer - pointing to the same. Sorry I forgot. Thank you for burning midnight oil! Really appreciated.