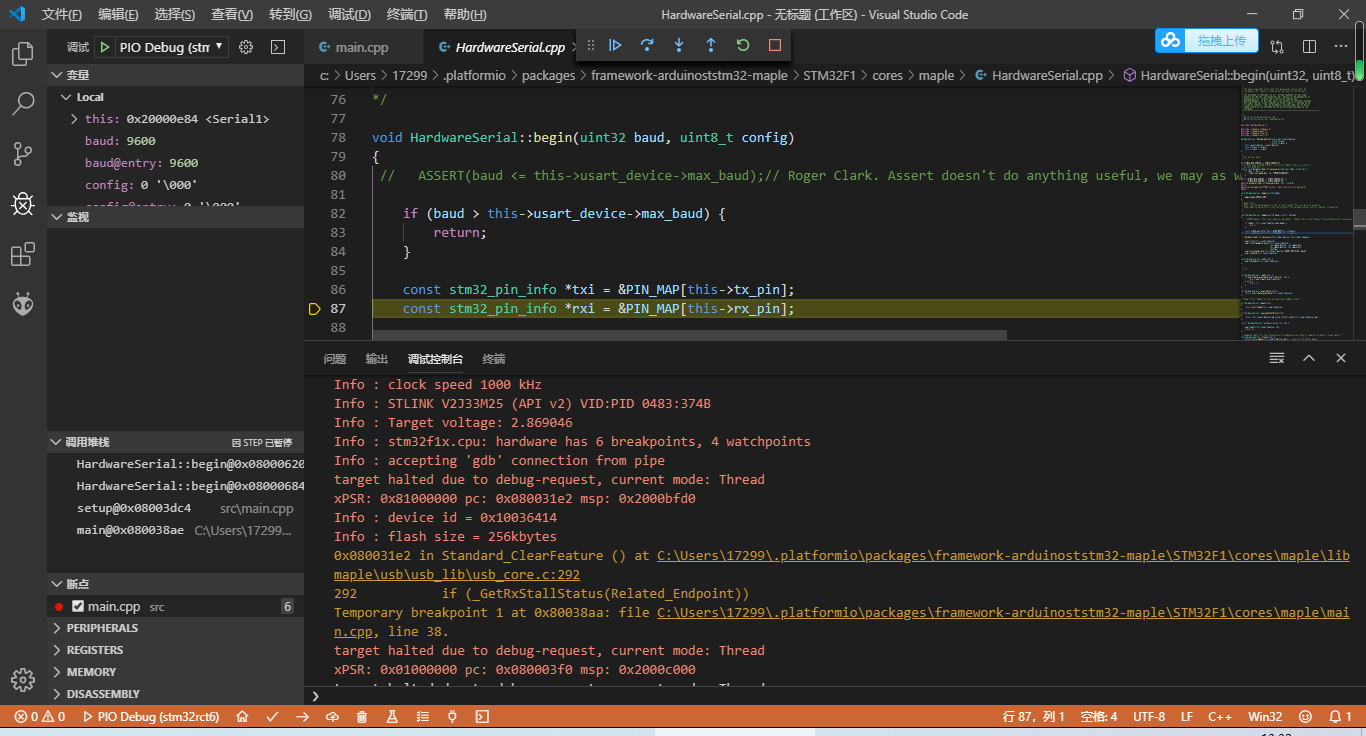
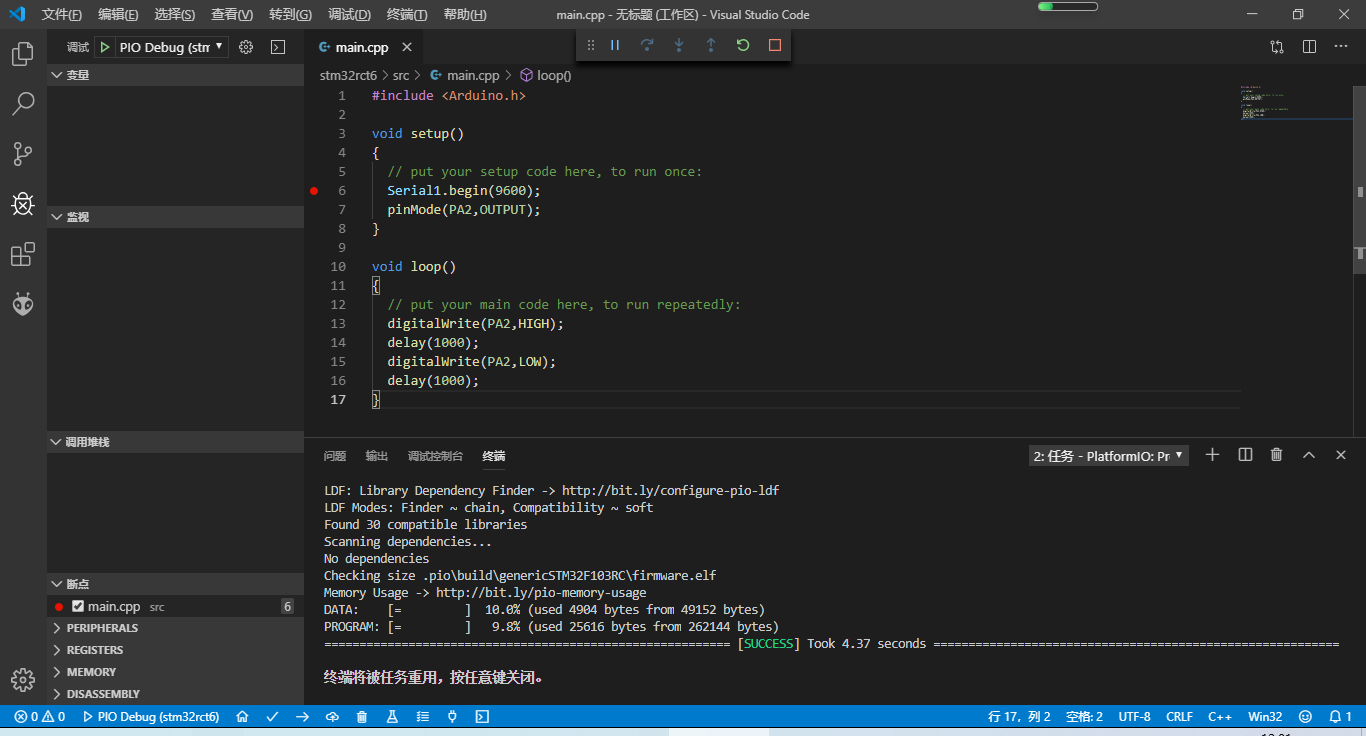
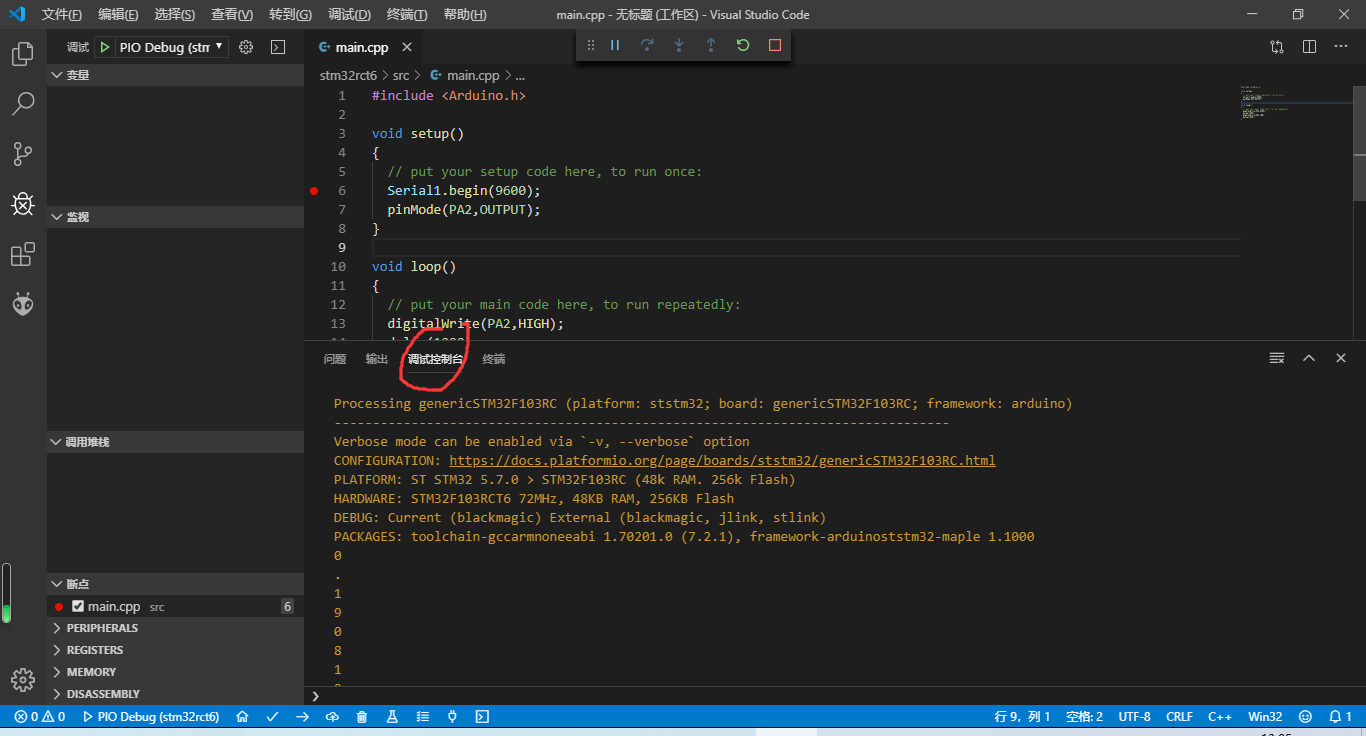
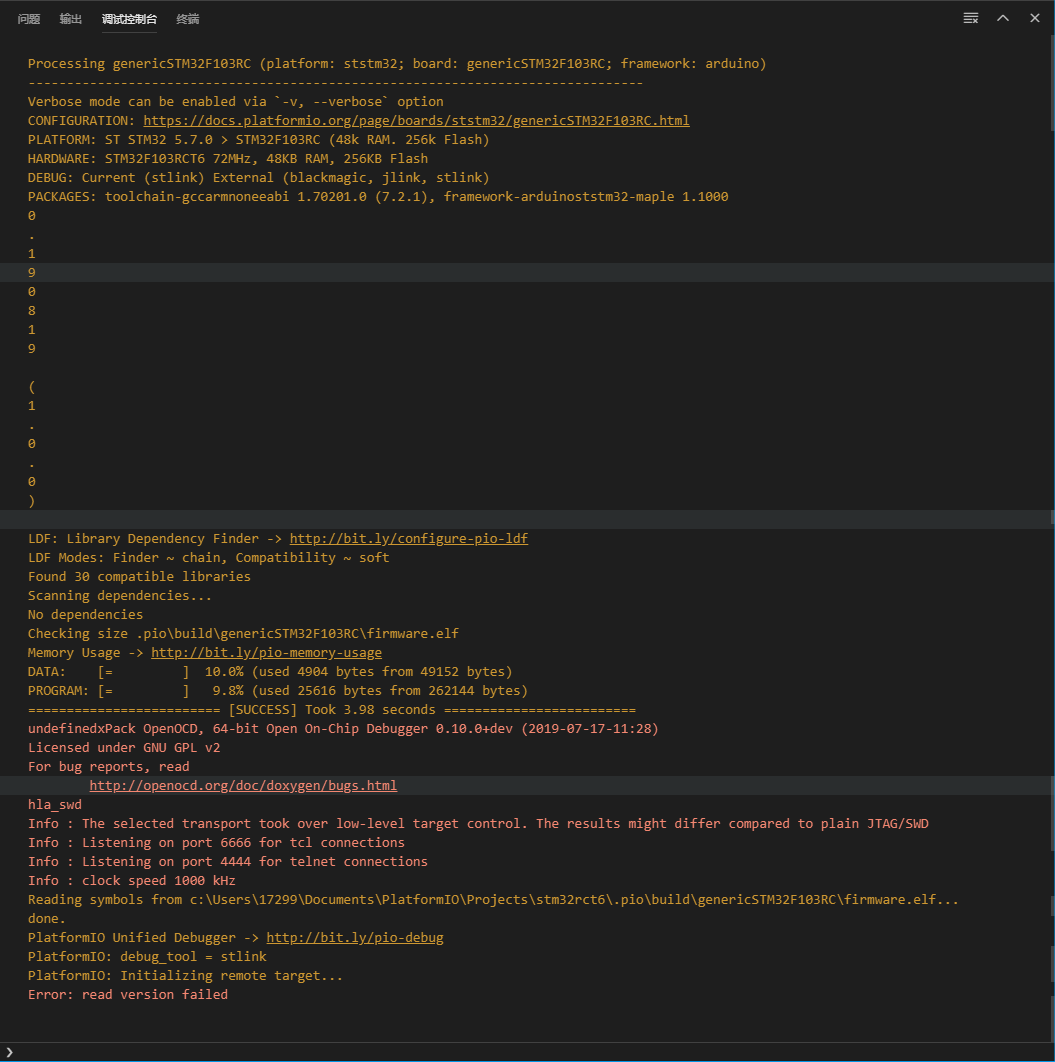
Hello everyone. The chip I am using is STM32F103RCT6, the frame is arduino, the debugger is “stlink”, then I use “platformio” for debugging, I found that he will stop on this page, can’t debug
The STM32F103 chip and its Arduino framework can be debugged. I’ve done it several times.
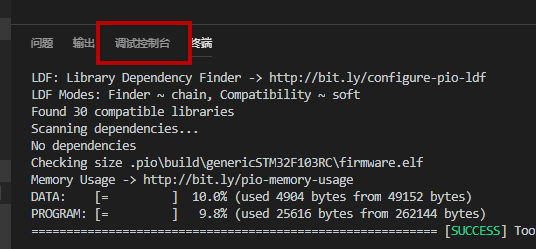
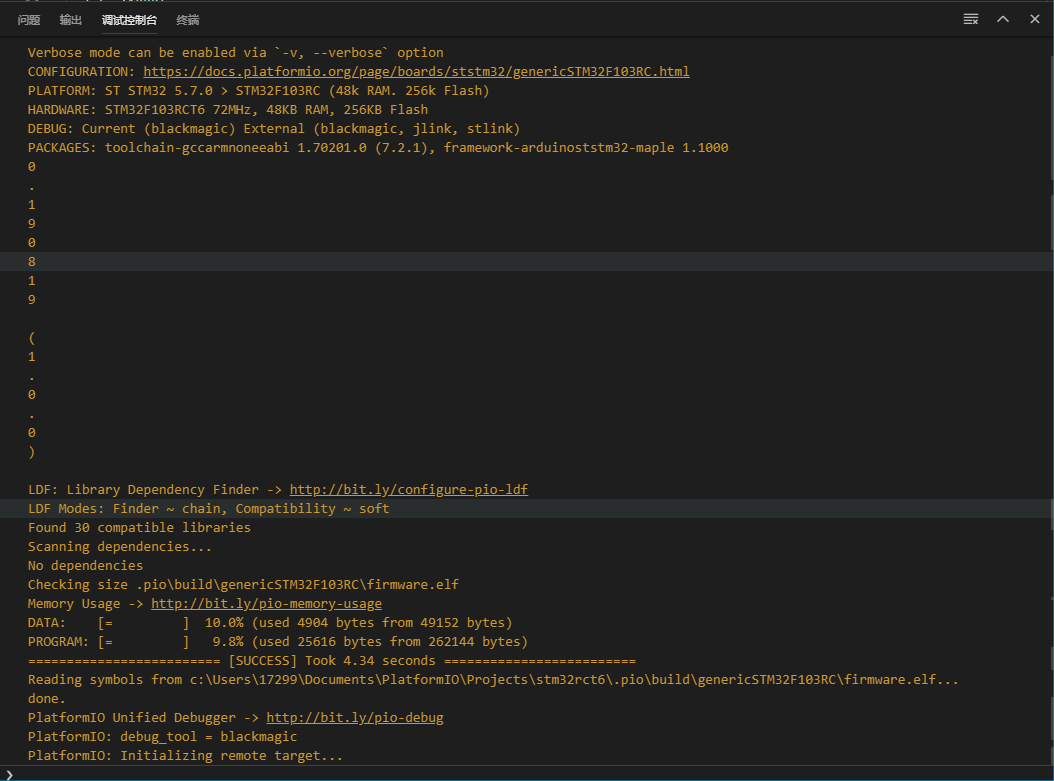
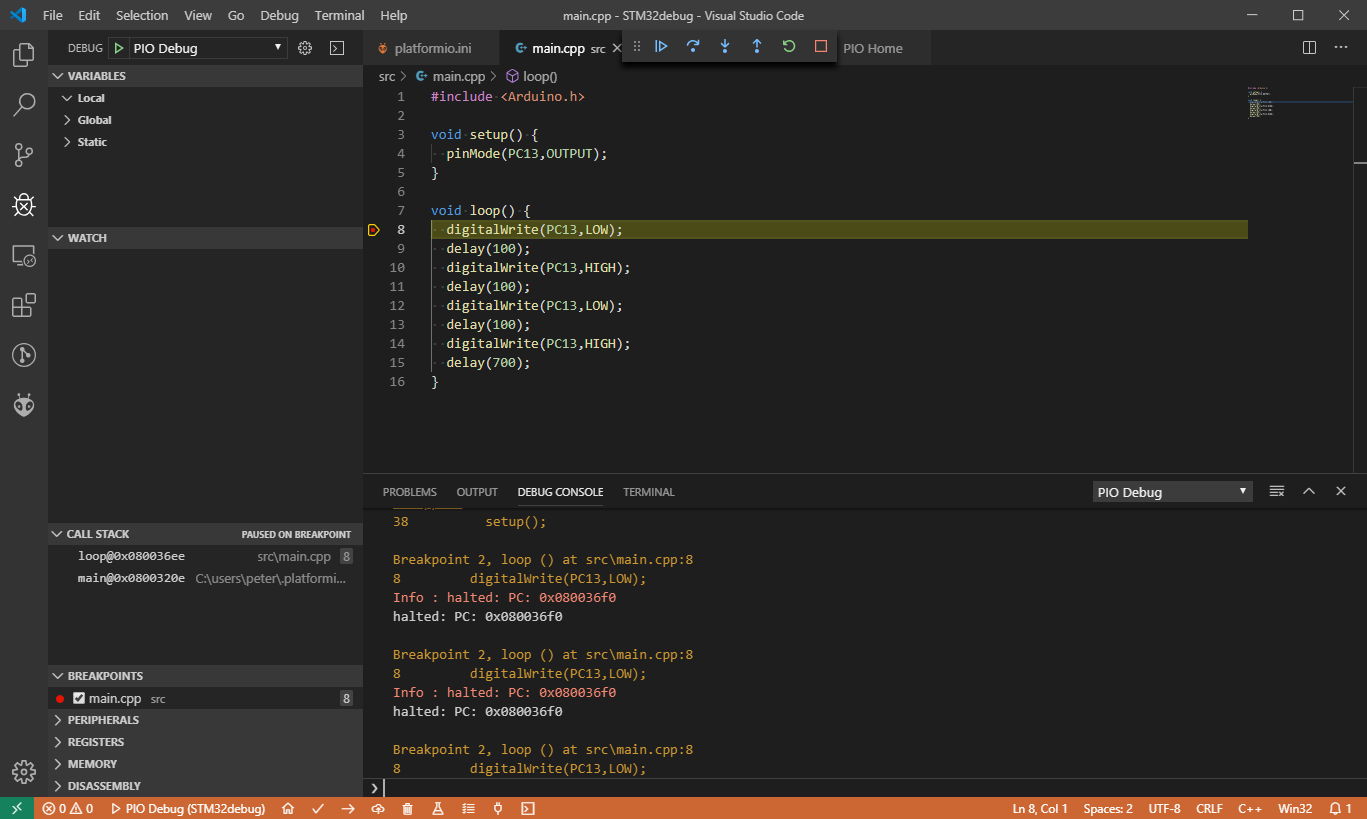
Can you show the output from the Debug Console. It’s likely the tab marked below:
1 Like
I added STlink as a debugging tool
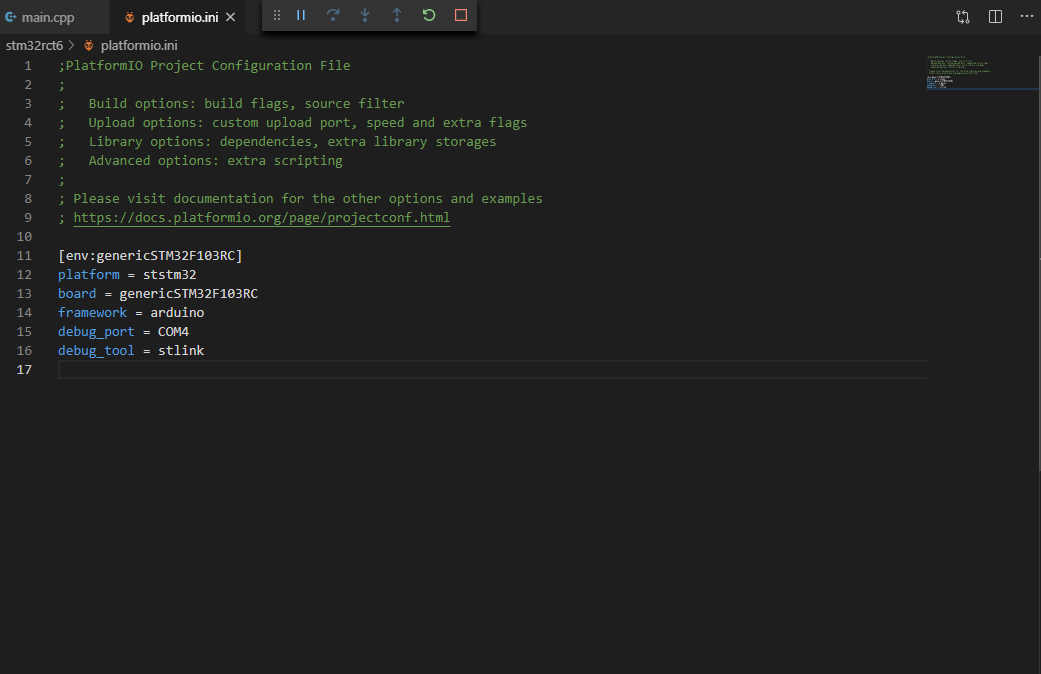
Try removing the debug_port = COM4 line for your STM32F103 project - I don’t think it’s valid stlink as it doesn’t expose a serial port. e.g. the following works fine for me with a stlink for a F103CB
[env:genericSTM32F103CB]
platform = ststm32
board = genericSTM32F103CB
framework = arduino
debug_tool = stlink
upload_protocol = stlink
Processing genericSTM32F103CB (platform: ststm32; board: genericSTM32F103CB; framework: arduino)
-------------------------------------------------------------------------------
Verbose mode can be enabled via `-v, --verbose` option
CONFIGURATION: https://docs.platformio.org/page/boards/ststm32/genericSTM32F103CB.html
PLATFORM: ST STM32 5.7.0 > STM32F103CB (20k RAM. 128k Flash)
HARDWARE: STM32F103CBT6 72MHz, 20KB RAM, 128KB Flash
DEBUG: Current (stlink) External (blackmagic, jlink, stlink)
PACKAGES: toolchain-gccarmnoneeabi 1.70201.0 (7.2.1), framework-arduinoststm32-maple 1.1000
0
.
1
9
0
8
1
9

(
1
.
0
.
0
)


LDF: Library Dependency Finder -> http://bit.ly/configure-pio-ldf
LDF Modes: Finder ~ chain, Compatibility ~ soft
Found 30 compatible libraries
Scanning dependencies...
No dependencies
Checking size .pio\build\genericSTM32F103CB\firmware.elf
Advanced Memory Usage is available via
DATA:    [==        ]  20.9% (used 4288 bytes from 20480 bytes)
PROGRAM: [==        ]  17.6% (used 23124 bytes from 131072 bytes)
========================= [SUCCESS] Took 8.34 seconds =========================
Reading symbols from e:\Projects\PlatformIO\STM32\STM32debug\.pio\build\genericSTM32F103CB\firmware.elf...
done.
PlatformIO Unified Debugger -> http://bit.ly/pio-debug
PlatformIO: debug_tool = stlink
PlatformIO: Initializing remote target...
xPack OpenOCD, 32-bit Open On-Chip Debugger 0.10.0+dev (2019-07-17-07:34)
Licensed under GNU GPL v2
For bug reports, read
	http://openocd.org/doc/doxygen/bugs.html
hla_swd
Info : The selected transport took over low-level target control. The results might differ compared to plain JTAG/SWD
Info : tcl server disabled
Info : telnet server disabled
Info : clock speed 1000 kHz
Info : STLINK V2J31S7 (API v2) VID:PID 0483:3748
Info : Target voltage: 3.175916
Info : stm32f1x.cpu: hardware has 6 breakpoints, 4 watchpoints
Info : accepting 'gdb' connection from pipe
target halted due to debug-request, current mode: Thread
xPSR: 0x21000000 pc: 0x080036be msp: 0x20004fd8
Info : device id = 0x20036410
Info : flash size = 64kbytes
0x080036be in micros () at C:\users\peter\.platformio\packages\framework-arduinoststm32-maple\STM32F1\cores\maple/wirish_time.h:69
69	            (SYSTICK_RELOAD_VAL + 1 - cycle_cnt) / CYCLES_PER_MICROSECOND);
Temporary breakpoint 1 at 0x8003206: file C:\users\peter\.platformio\packages\framework-arduinoststm32-maple\STM32F1\cores\maple\main.cpp, line 38.
target halted due to debug-request, current mode: Thread
xPSR: 0x01000000 pc: 0x080003e4 msp: 0x20005000
target halted due to debug-request, current mode: Thread
xPSR: 0x01000000 pc: 0x080003e4 msp: 0x20005000
target halted due to debug-request, current mode: Thread
xPSR: 0x01000000 pc: 0x080003e4 msp: 0x20005000
Loading section .text, size 0x4548 lma 0x8000000
Loading section .ARM.exidx, size 0x8 lma 0x8004548
Loading section .data, size 0xc80 lma 0x8004550
Loading section .rodata, size 0x884 lma 0x80051d0
target halted due to debug-request, current mode: Thread
xPSR: 0x01000000 pc: 0x080003e4 msp: 0x20005000
Start address 0x80003e4, load size 23124
Transfer rate: 15 KB/sec, 4624 bytes/write.
target halted due to debug-request, current mode: Thread
xPSR: 0x01000000 pc: 0x080003e4 msp: 0x20005000
target halted due to debug-request, current mode: Thread
xPSR: 0x01000000 pc: 0x080003e4 msp: 0x20005000
PlatformIO: Initialization completed
PlatformIO: Resume the execution to `debug_init_break = tbreak main`
PlatformIO: More configuration options -> http://bit.ly/pio-debug
Note: automatically using hardware breakpoints for read-only addresses.

Temporary breakpoint 1, main () at C:\users\peter\.platformio\packages\framework-arduinoststm32-maple\STM32F1\cores\maple\main.cpp:38
38	    setup();

Breakpoint 2, loop () at src\main.cpp:8
8	  digitalWrite(PC13,LOW);
Info : halted: PC: 0x080036f0
halted: PC: 0x080036f0

Breakpoint 2, loop () at src\main.cpp:8
8	  digitalWrite(PC13,LOW);
Info : halted: PC: 0x080036f0
halted: PC: 0x080036f0

Breakpoint 2, loop () at src\main.cpp:8
8	  digitalWrite(PC13,LOW);
1 Like