Hello,
Created a svd file for new RISC-V 32 SoC based on Shakti processor. svd file is parsed correctly and all peripherals are getting listed.
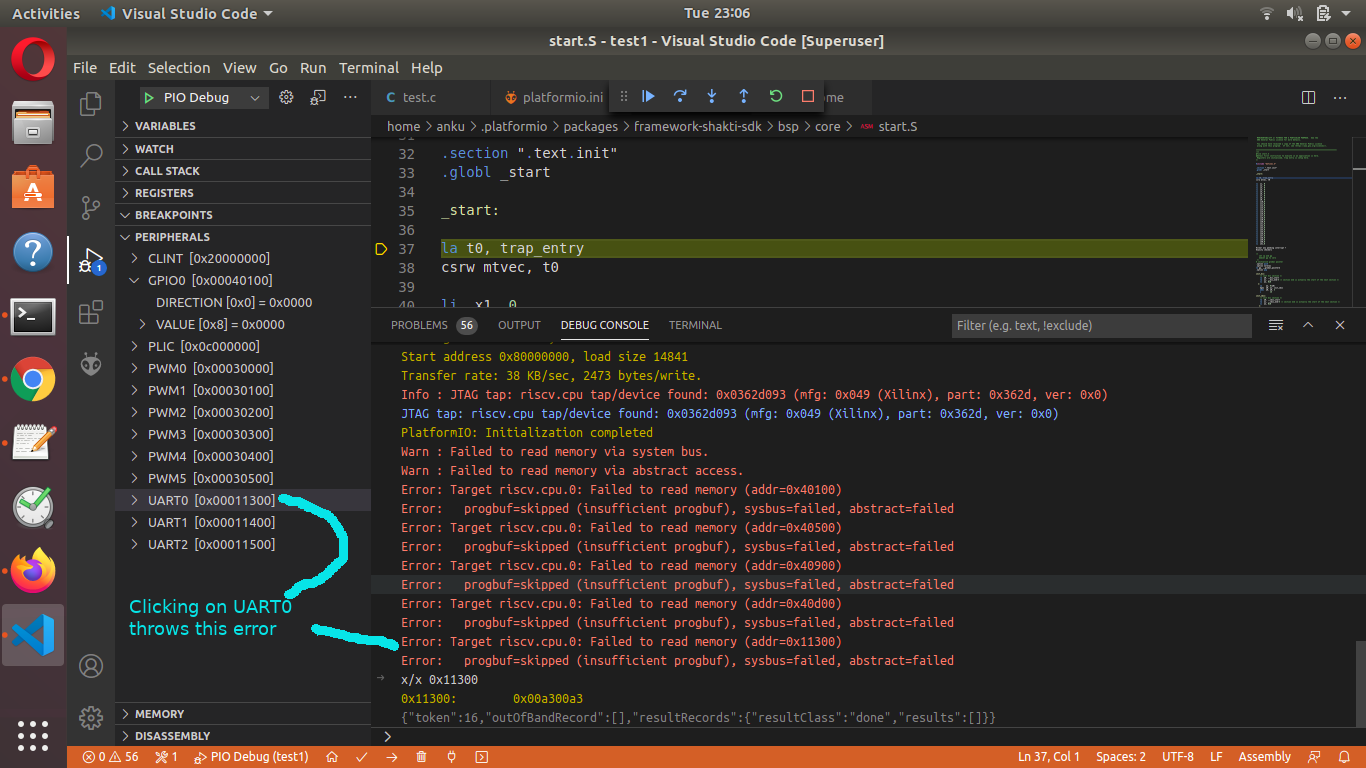
I am trying to access the peripheral registers mentioned in the svd file. When I click on the register getting following error
Error: Target riscv.cpu.0: Failed to read memory (addr=0x11300)
Error: progbuf=skipped (insufficient progbuf), sysbus=failed, abstract=failed
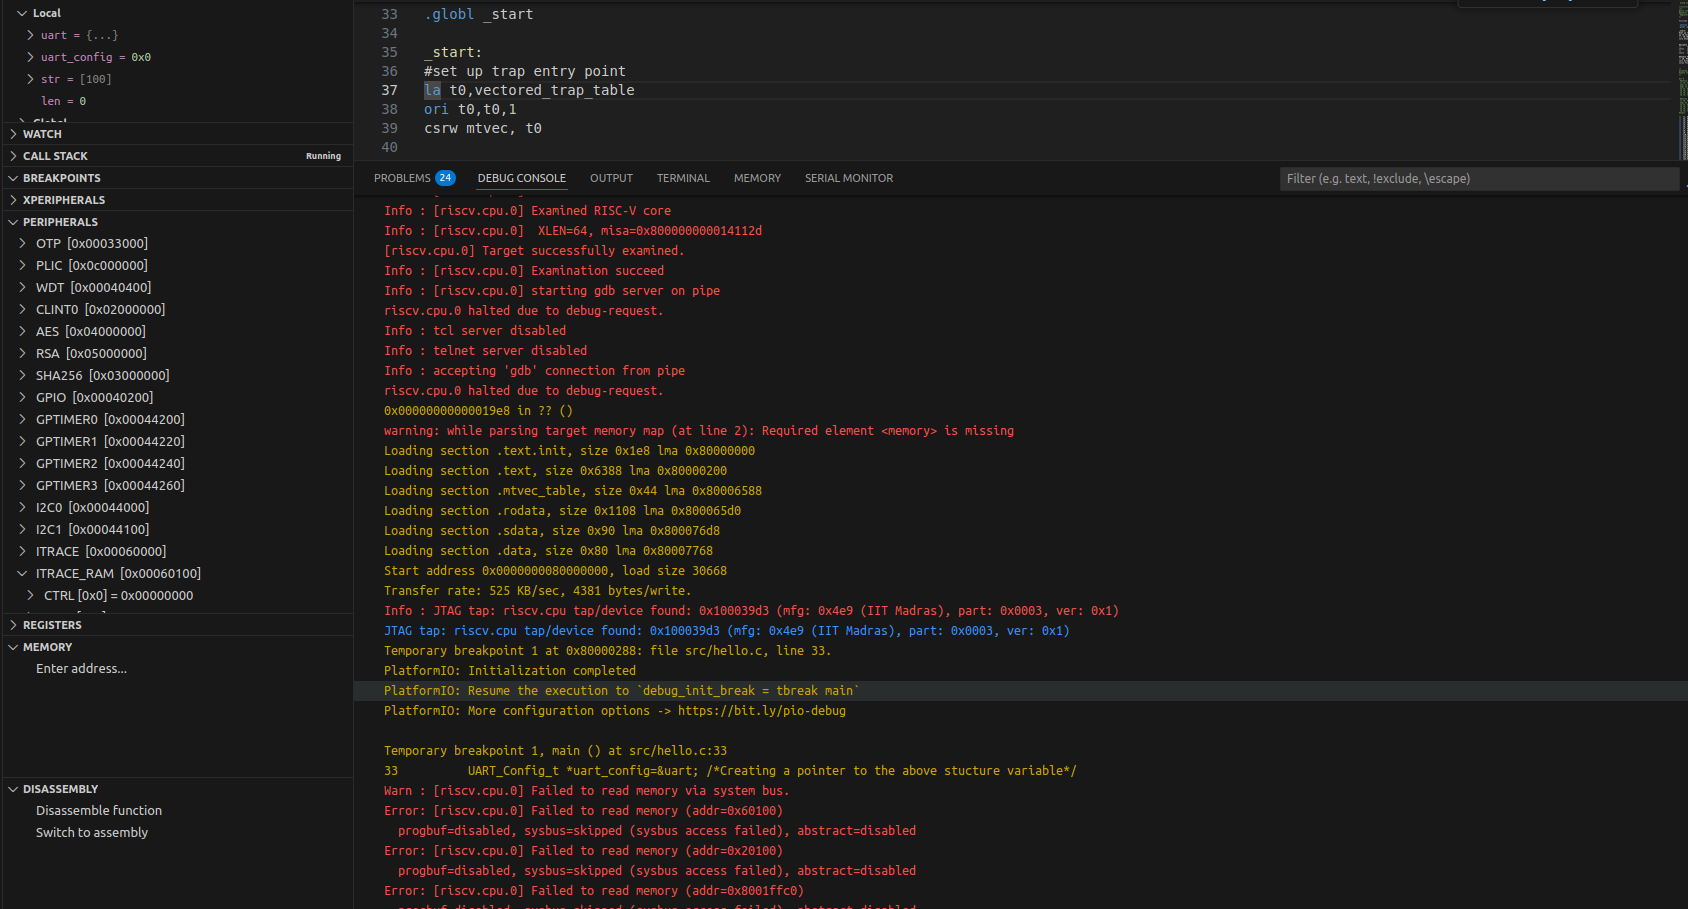
When I try to access the same memory location using Debug Console, getting the correct value.
Is there any setting or config I am missing here, kindly let me know.
Attaching screen shot displaying the error.
Thanks & Regards,
Anand
Seems like the error message is thrown by OpenOCD. I suggest you modify the platformio.ini so that it doesn’t open the OpenOCD server itself but connects to an external one, that you yourself open withh maximum verbositity.
According to doc you should set, in the platformio.ini,
debug_tool = custom
debug_port = localhost:3333
invoke your openocd for RISC-V (I assume you’re using a copy of this) with the appropriate config flags and the -d3 flag in a new shell. That should open the new gdbserver at port 3333. Then start debugging in VSCode as normal. After it connects, readout the peripheral register again and check the new output that has appeared. Maybe that gives a clue.
Other than that I can just suggest to ask for help at Issues · riscv/riscv-openocd · GitHub with the full diagnostic output and your SVD file.
Hi,
Thanks for your suggestion. Tried it.
I am getting the same error in openocd. Can you please let me know how PIO communicates with the board to get the values in the address mentioned in svd file.
This will help a lot in understanding PIO. If there are any documents, please point them to me.
Thanks & Regards,
Anand
Well from the OpenOCD debug output you can see how it requests the information from openocd, which is the critical part. I’m sure people at the OpenOCD repo can tell you what PIO is exactly requesting and why the request fails (or they see a bug of theirs).
I’m not sure on where the code for the unified debugger UI in VSCode is (apparently not in GitHub - platformio/platformio-vscode-ide: PlatformIO IDE for VSCode: The next generation integrated development environment for IoT or GitHub - platformio/platformio-core: Your Gateway to Embedded Software Development Excellence 👽), but the code for GDB and OpenOCD are open. Maybe @ivankravets can point there, or explain how the SVD values go into the UI and how a GDB or openocd read request is formed from those?
1 Like
Please replace LOG_FILE line 30 with a path to the log file
https://github.com/platformio/platformio-core/blob/develop/platformio/commands/debug/process/base.py#L30
For example, LOG_FILE = C:/piodebug.log
You will see all commands.
Hi, did you ever manage to find a solution for this? I’m facing a similar issue, but in my case it’s on a RISC-V 64 SoC based on the Shakti processor. I also tried the same procedure you described by externally connecting OpenOCD, but unfortunately it didn’t work for me either.
Hi, thank you for sharing this! The link you posted doesn’t seem to work anymore. Could you please point me to the updated location of that file in the PlatformIO repo
Yes thank you,
Could someone please explain how values from an SVD file go into the peripheral view UI, and how a GDB/OpenOCD memory read request is generated based on those SVD definitions.