Problem with esp-prog with Espressif ESP32 DevKit, must be missing something

I followed all the instructions from

I feel that I’m very close but just can’t get it to debug.

I bought the esp-prog and the expressif 356-ESP32-DEVKITC32D dev kit,
I connected the 2 boards (3.3V, gnd, jtag 12,13,14,15), installed vscode and platformio.

I installed FTDI and Zadig

I connected a usb cable to the esp-prog to my computer (COM5) and a second usb cable to the esp32 to my computer on an other usb port (COM7).
I feel that I followed all the instructions but when I tried to debug, it fails to connect properly to gdb.
I’m using visual studio with platformio on windows 10.

I don’t know what else to do

I think that the debug code is not getting upload in the esp32 (Start debug compiles it in debug but then doesn’t upload it)
and then the debugger console has some issues (see logs below)

my platformio.ini has the following

[env:esp32dev]
platform = espressif32
board = esp32dev
framework = arduino
; Serial Monitor options
monitor_speed = 115200
upload_port = COM5
debug_port = COM7
debug_tool = esp-prog
debug_init_break = tbreak setup

Here is the output of my debug console.

------------------------------------------------
Processing esp32dev (platform: espressif32; board: esp32dev; framework: arduino)
--------------------------------------------------------------------------------
Verbose mode can be enabled via `-v, --verbose` option
CONFIGURATION: docs.platformio /page/boards/espressif32/esp32dev
PLATFORM: Espressif 32 1.12.0 > Espressif ESP32 Dev Module
HARDWARE: ESP32 240MHz, 320KB RAM, 4MB Flash
DEBUG: Current (esp-prog) External (esp-prog, iot-bus-jtag, jlink, minimodule, olimex-arm-usb-ocd, olimex-arm-usb-ocd-h, olimex-arm-usb-tiny-h, olimex-jtag-tiny, tumpa)
PACKAGES: 
 - framework-arduinoespressif32 3.10004.200129 (1.0.4) 
 - tool-esptoolpy 1.20600.0 (2.6.0) 
 - toolchain-xtensa32 2.50200.80 (5.2.0)
LDF: Library Dependency Finder ->bit.ly/configure-pio-ldf
LDF Modes: Finder ~ chain, Compatibility ~ soft
Found 26 compatible libraries
Scanning dependencies...
Dependency Graph
|-- <WiFi> 1.0
Building in debug mode
Retrieving maximum program size .pio\build\esp32dev\firmware.elf
Checking size .pio\build\esp32dev\firmware.elf
Advanced Memory Usage is available via "PlatformIO Home > Project Inspect"
RAM:   [=         ]  11.9% (used 39064 bytes from 327680 bytes)
Flash: [=====     ]  52.1% (used 683238 bytes from 1310720 bytes)
========================= [SUCCESS] Took 3.92 seconds =========================
undefinedOpen On-Chip Debugger  v0.10.0-esp32-20190708 (2019-07-08-11:04)
Licensed under GNU GPL v2
For bug reports, read

none separate
adapter speed: 20000 kHz
Info : Configured 2 cores
esp32 interrupt mask on
Info : Listening on port 6666 for tcl connections
Info : Listening on port 4444 for telnet connections
Error: libusb_open() failed with LIBUSB_ERROR_NOT_SUPPORTED
Info : ftdi: if you experience problems at higher adapter clocks, try the command "ftdi_tdo_sample_edge falling"
Info : clock speed 20000 kHz
Info : JTAG tap: esp32.cpu0 tap/device found: 0x120034e5 (mfg: 0x272 (Tensilica), part: 0x2003, ver: 0x1)
Info : JTAG tap: esp32.cpu1 tap/device found: 0x120034e5 (mfg: 0x272 (Tensilica), part: 0x2003, ver: 0x1)
Info : esp32: Debug controller 0 was reset (pwrstat=0x5F, after clear 0x0F).
Info : esp32: Core 0 was reset (pwrstat=0x5F, after clear 0x0F).
Info : esp32: Debug controller 1 was reset (pwrstat=0x5F, after clear 0x0F).
Info : esp32: Core 1 was reset (pwrstat=0x5F, after clear 0x0F).
Info : Detected debug stubs @ 3ffc1cb8 on core0 of target 'esp32'
Info : Listening on port 3333 for gdb connections
Reading symbols from c:\Users\vince\Documents\PlatformIO\Projects\Esp32 time\.pio\build\esp32dev\firmware.elf...
done.
PlatformIO Unified Debugger ->pio-debug
PlatformIO: debug_tool = esp-prog
PlatformIO: Initializing remote target...
Info : xtensa_poll: Target offline
Error: xtensa_poll: Target failure
Polling target esp32 failed, trying to reexamine
Error: cpu0: esp32_fetch_all_regs (line 273): DSR (FFFFFFFF) indicates target still busy!
Error: cpu0: esp32_fetch_all_regs (line 273): DSR (FFFFFFFF) indicates DIR instruction generated an exception!
Error: cpu0: esp32_fetch_all_regs (line 273): DSR (FFFFFFFF) indicates DIR instruction generated an overrun!
Error: cpu0: esp32_fetch_all_regs (line 303): DSR (FFFFFFFF) indicates target still busy!
Error: cpu0: esp32_fetch_all_regs (line 303): DSR (FFFFFFFF) indicates DIR instruction generated an exception!
Error: cpu0: esp32_fetch_all_regs (line 303): DSR (FFFFFFFF) indicates DIR instruction generated an overrun!
Error: Exception reading pc!

Info : Target halted. PRO_CPU: PC=0x00000000 (active)    APP_CPU: PC=0x00000000 
Error: cpu0: xtensa_write_memory (line 807): DSR (120034E5) indicates target still busy!
Warn : esp32: Failed writing 4 bytes at address 0x3ff5f064, data - a1, 3a, d8, 50, 98, 52, 1c, 01
Error: Failed to write ESP32_TIMG0WDT_PROTECT (-4)!
Error: cpu0: xtensa_read_memory (line 700): DSR (FFFFFFFF) indicates target still busy!
Error: cpu0: xtensa_read_memory (line 700): DSR (FFFFFFFF) indicates DIR instruction generated an exception!
Error: cpu0: xtensa_read_memory (line 700): DSR (FFFFFFFF) indicates DIR instruction generated an overrun!
Warn : cpu0: Failed reading 16 bytes at address 0x3ffc1cb8
Error: Failed to read target memory (-4)!
Info : xtensa_poll: Target offline
Error: xtensa_poll: Target failure
Polling target esp32 failed, trying to reexamine
Examination failed, GDB will be halted. Polling again in 100ms
Error: xtensa_poll: Target failure
Polling target esp32 failed, trying to reexamine
Examination failed, GDB will be halted. Polling again in 300ms

Thank you
Vince

The error message:

Error: libusb_open() failed with LIBUSB_ERROR_NOT_SUPPORTED

could indicate that you have not properly changed the driver using Zadig. Ensure that it looks similar to this:

The debug_port line doesn’t make sense:

debug_port = COM7

The idea of using Zadig is to disable the COM port restricting the ESP-Prog and allowing WinUSB/libUSB to access all features of the debugger. Most likely, the line is ignored. But remove it anyway.

1 Like

Looks like suddenly all bits are 1 on the JTAG lines. But it initially does recognize the XTensa processor via JTAG. Maybe you can try and decrease the 20MHz adapter speed as seen in ESP32 + J-link debugger does not start - #12 by Yourigh to make it more reliable?

Thank you very much Manuel, your explanation of the COM port usage was great.
I got it to work.
My first mistake was to connect USB to the 2 boards, so I disconnected the usb from the esp32 and then I removed
upload_port = COM5
debug_port = COM7
from the platformio.ini

I thought I needed the usb cable to the esp32 to program it and I did not realize that it was going thru the esp32 during debug mode.

It looks like I can’t see anything in serial monitor, is that the reason there is a serial port on the esp-prog?
Is there any tutorial on getting that configured by any chance?

Thank you
Vince

The general guide from Espressif is at https://github.com/espressif/esp-iot-solution/blob/master/documents/evaluation_boards/ESP-Prog_guide_en.md. If you want to see the UART output through the second channel of your FT2232HL of the esp-prog, make sure you don’t override that driver in Zadig. You then have to of course conncet the TXD and RXD signals to the esp, as this section says.

However, since you’re using the ESP32-DEVKITC32D dev kit, you already have a USB-UART chip onboard that can be used without any additional wireup. Double check that the correct COM port is selected and set the monitor_port and monitor_speed (usually 115200 or whatever you have in the Serial.begin() of yor firmware) accordingly.

Hi Max,

I tried with and without connecting TXprog<->RXesp32, RXprog<->TXesp32 and I never see anything in the serial monitor when using the esp-prog (COM7, I don’t see another COM port available for interface 1 of the Dual RS232-HS). If I connect the esp32 directly via USB (without the esp-prog) on a different USB port of my computer (I get COM4) and the serial monitor shows my prints (but of course I can’t debug). I will put both logs below and here is a snippet of my program

void printLocalTime()
{
  struct tm timeinfo;
  if(!getLocalTime(&timeinfo)){
    Serial.println("Failed to obtain time");
    return;
  }
  Serial.println(&timeinfo, "%A, %B %d %Y %H:%M:%S");
  Serial.printf("loop=%d\n",count++);
}

here are the logs with esp-prog

--------------------------------------------------
Linking .pio\build\esp32dev\firmware.elf
Retrieving maximum program size .pio\build\esp32dev\firmware.elf
Building .pio\build\esp32dev\firmware.bin
Checking size .pio\build\esp32dev\firmware.elf
Advanced Memory Usage is available via "PlatformIO Home > Project Inspect"
RAM:   [=         ]  11.8% (used 38744 bytes from 327680 bytes)
Flash: [=====     ]  48.1% (used 631070 bytes from 1310720 bytes)
esptool.py v2.6
Configuring upload protocol...
AVAILABLE: esp-prog, espota, esptool, iot-bus-jtag, jlink, minimodule, olimex-arm-usb-ocd, olimex-arm-usb-ocd-h, olimex-arm-usb-tiny-h, olimex-jtag-tiny, tumpa
CURRENT: upload_protocol = esp-prog
Uploading .pio\build\esp32dev\firmware.bin
Open On-Chip Debugger  v0.10.0-esp32-20190708 (2019-07-08-11:04)
Licensed under GNU GPL v2
For bug reports, read
        http://openocd.org/doc/doxygen/bugs.html
debug_level: 1
none separate
adapter speed: 20000 kHz
esp32 interrupt mask on
Error: libusb_open() failed with LIBUSB_ERROR_NOT_SUPPORTED
** Programming Started **
auto erase enabled
wrote 634880 bytes from file .pio\build\esp32dev\firmware.bin in 4.670913s (132.736 KiB/s)
** Programming Finished **
** Verify Started **
read 631184 bytes from file .pio\build\esp32dev\firmware.bin and flash bank 0 at offset 0x00010000 in 2.407121s (256.070 KiB/s)
contents match
** Verified OK **
** Programming Started **
auto erase enabled
wrote 16384 bytes from file C:/Users/vince/.platformio/packages/framework-arduinoespressif32/tools/sdk/bin/bootloader_dio_40m.bin in 0.721419s (22.179 KiB/s)
** Programming Finished **
** Verify Started **      
read 15872 bytes from file C:/Users/vince/.platformio/packages/framework-arduinoespressif32/tools/sdk/bin/bootloader_dio_40m.bin and flash bank 0 at offset 0x00001000 in 0.292007s (53.081 KiB/s)
contents match
** Verified OK **
** Programming Started **
auto erase enabled
wrote 4096 bytes from file C:/Users/vince/Documents/PlatformIO/Projects/Esp32 time/.pio/build/esp32dev/partitions.bin in 0.585866s (6.827 KiB/s)
** Programming Finished **
** Verify Started **      
read 3072 bytes from file C:/Users/vince/Documents/PlatformIO/Projects/Esp32 time/.pio/build/esp32dev/partitions.bin and flash bank 0 at offset 0x00008000 in 0.252076s (11.901 KiB/s)
contents match
** Verified OK **
** Programming Started **
auto erase enabled
wrote 8192 bytes from file C:/Users/vince/.platformio/packages/framework-arduinoespressif32/tools/partitions/boot_app0.bin in 0.644423s (12.414 KiB/s)
** Programming Finished **
** Verify Started **      
read 8192 bytes from file C:/Users/vince/.platformio/packages/framework-arduinoespressif32/tools/partitions/boot_app0.bin and flash bank 0 at offset 0x0000e000 in 0.529053s (15.121 KiB/s)
contents match
** Verified OK **
shutdown command invoked
Warn : Flash driver of esp32.flash does not support free_driver_priv()
Warn : Flash driver of irom does not support free_driver_priv()       
Warn : Flash driver of drom does not support free_driver_priv()       
======================================================================================= [SUCCESS] Took 28.47 seconds =======================================================================================
> Executing task in folder Esp32 time: C:\Users\vince\.platformio\penv\Scripts\platformio.exe device monitor <

--- Available filters and text transformations: colorize, debug, default, direct, esp32_exception_decoder, hexlify, log2file, nocontrol, printable, send_on_enter, time
--- More details at http://bit.ly/pio-monitor-filters
--- Miniterm on COM7  115200,8,N,1 ---
--- Quit: Ctrl+C | Menu: Ctrl+T | Help: Ctrl+T followed by Ctrl+H ---

logs of serial monitor with just esp32

> Executing task in folder Esp32 time: C:\Users\vince\.platformio\penv\Scripts\platformio.exe device monitor <

--- Available filters and text transformations: colorize, debug, default, direct, esp32_exception_decoder, hexlify, log2file, nocontrol, printable, send_on_enter, time
--- More details at http://bit.ly/pio-monitor-filters
--- Miniterm on COM4  115200,8,N,1 ---
--- Quit: Ctrl+C | Menu: Ctrl+T | Help: Ctrl+T followed by Ctrl+H ---  
ets Jun  8 2016 00:22:57

rst:0x1 (POWERON_RESET),boot:0x13 (SPI_FAST_FLASH_BOOT)
configsip: 0, SPIWP:0xee
clk_drv:0x00,q_drv:0x00,d_drv:0x00,cs0_drv:0x00,hd_drv:0x00,wp_drv:0x00
mode:DIO, clock div:2
load:0x3fff0018,len:4
load:0x3fff001c,len:1044
load:0x40078000,len:8896
load:0x40080400,len:5828
entry 0x400806ac
Connecting to NETGEAR65VB . CONNECTED
Saturday, April 11 2020 18:22:06
loop=0
 Leaving Wifi
Saturday, April 11 2020 18:22:07
loop=1
Saturday, April 11 2020 18:22:08
loop=22
Saturday, April 11 2020 18:22:09
loop=43
Saturday, April 11 2020 18:22:10
loop=64
Saturday, April 11 2020 18:22:11
loop=85
Saturday, April 11 2020 18:22:12
loop=106
Saturday, April 11 2020 18:22:13
loop=127

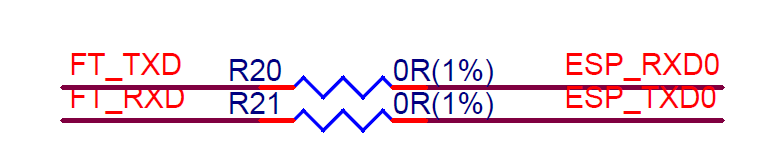
Hm first of all I think that connecting the TXD from the ESP-Prog to the RXD of the ESP32 might be bad idea if the on-board USB-UART bridge tries to drive the output as well. But only RXD->TXD (ESP) should be good (2 receivers). Also a common GND must be there, but if you are connected to the JTAG board you already have common GND.

Do you see any activity on the LEDs (https://github.com/espressif/esp-iot-solution/blob/master/documents/evaluation_boards/ESP-Prog_guide_en.md#325-led-status-indication) when the esp-prog UART is connected to the ESP and the ESP prints something?

There might also still be a driver issue, so try re-plugging the board. In the initial state both FT2232HL channels should be seen as COM ports, whereas the lower comport number is the JTAG channel and the higher one is the UART channel. When you change the drivers from Interface0 using Zadig, the higher COM port should still remain there unchanged. Is that the case?

Edit: Ah. Actually the signal labeled “ESP_TX” is the RX of the FT2232HL chip and needs to go the actual TX of the ESP32 board. So try flipping these around.

Hi Max,
Thank you so much for this help, like you said, connecting only the TX from the esp32 devkit to the TX_esp (pin3) on the esp-prog did the trick.
Now the serial monitor displays the prints and the Bridge_RX led on the esp_prog blinks as it prints on the serial monitor.
Visual code uses only COM7 for all this
It works both in debug mode and release mode :slight_smile:

To answer your question:
→ When you change the drivers from Interface0 using Zadig, the higher COM port should still remain there unchanged. Is that the case?
Zadig still shows interface 1 as available (and I have not touched it with zadig) but windows doesn’t give it another COM port. Both jtag and serial monitor use COM7, and it’s also the only COM that visual code sees under platformio->devices

Thank you again.
Vince