Right, so you have three suggested options for real-time graphing:
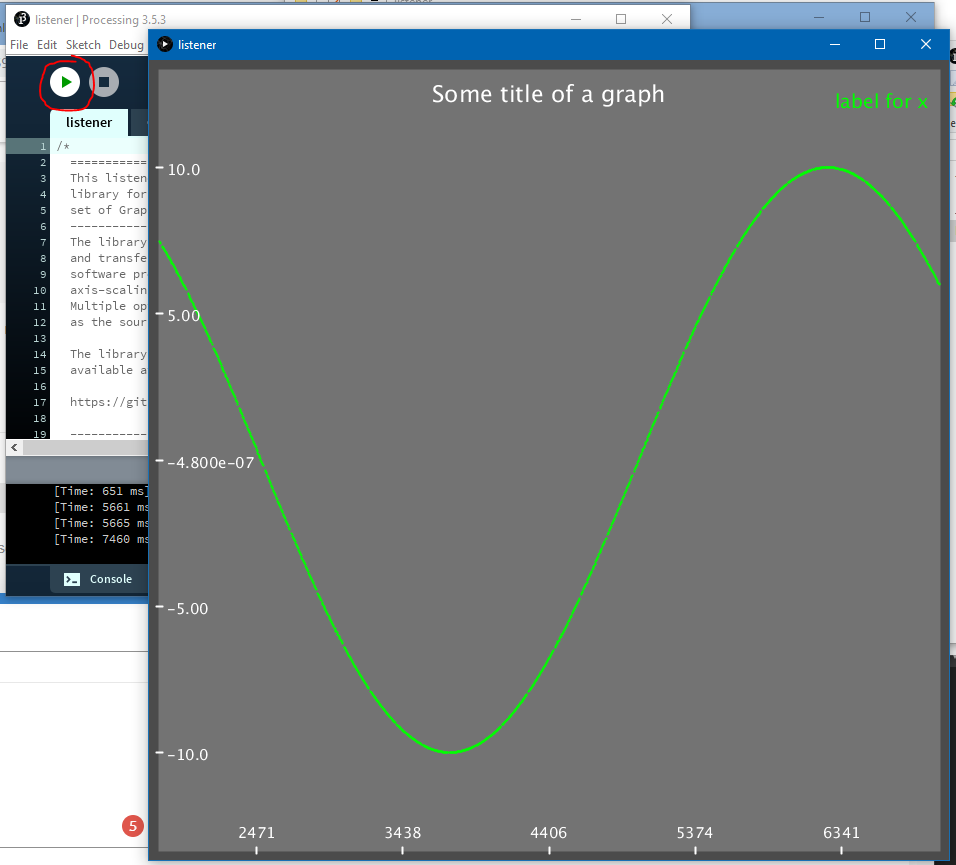
- Processing and Listener (Arduino plotter library v2.3.3)
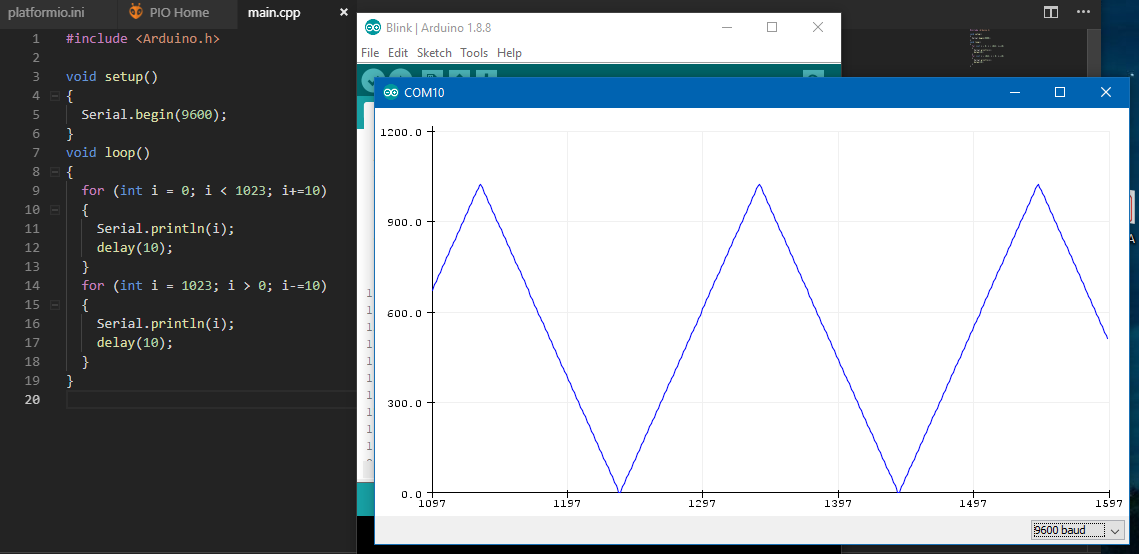
- Arduino IDE (Serial Plotter)
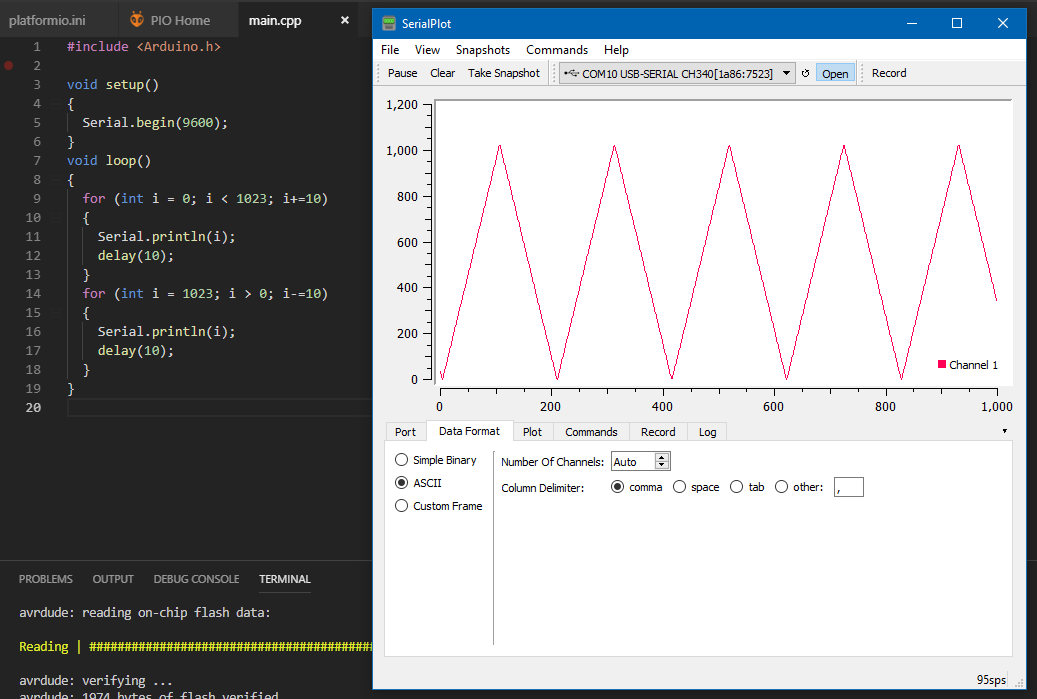
- SerialPlot
Note: I’m using a Arduino Uno as that is what I had handy, but this should work just fine with a Mega also.
For 1, you need to have downloaded processing, the listener app, and the library. lib_deps = 850 worked fine for me, so you should have it installed anyway if you did platformio lib install 850.
I tried the quick_start.ino listed on the library page, and added the requisite #include <Arduino.h> that was missing.
quick_start.ino code
#include <Arduino.h>

/*
  ===========================================================================================
  Example used in Quick-Start
  -------------------------------------------------------------------------------------------
  Plotter
  v2.3.0
  https://github.com/devinaconley/arduino-plotter
  by Devin Conley
  ===========================================================================================
*/

#include "Plotter.h"

double x;

Plotter p;

void setup()
{
    p.Begin();

    p.AddTimeGraph( "Some title of a graph", 1500, "label for x", x );
}

void loop() {
    x = 10*sin( 2.0*PI*( millis() / 5000.0 ) );

    p.Plot(); // usually called within loop()
}
I then ran up the processing ide (v3.5.3), opened the listener.pde, pressed the run button near the top left, and waited for it to start. It then scanned the serial ports, detected the device running graphing code, and started plotting the graph. So it does still seem to work.
For 2, I am referring to the Serial Plotter available from the Tools menu of the Arduino IDE, which works with simple Serial.println() statements
Code
#include <Arduino.h>

void setup()
{
  Serial.begin(9600);
}
void loop()
{
  for (int i = 0; i < 1023; i+=10)
  {
    Serial.println(i);
    delay(10);
  }
  for (int i = 1023; i > 0; i-=10)
  {
    Serial.println(i);
    delay(10);
  }
}
For 3, the exact same sort of ‘simple’ serial print data logging works with SerialPlot, once you choose the ‘ASCII’ (text) data format.