Hi, thanks so much.
Good tip.
I set winusb with Zadig and now C232HM seems to be recognized by PIO.
I tried to debug “blink app”.
Sometimes I debug successfully. I set a breakpoint in main_app and PIO stops there. Step/Continue works perfectly.
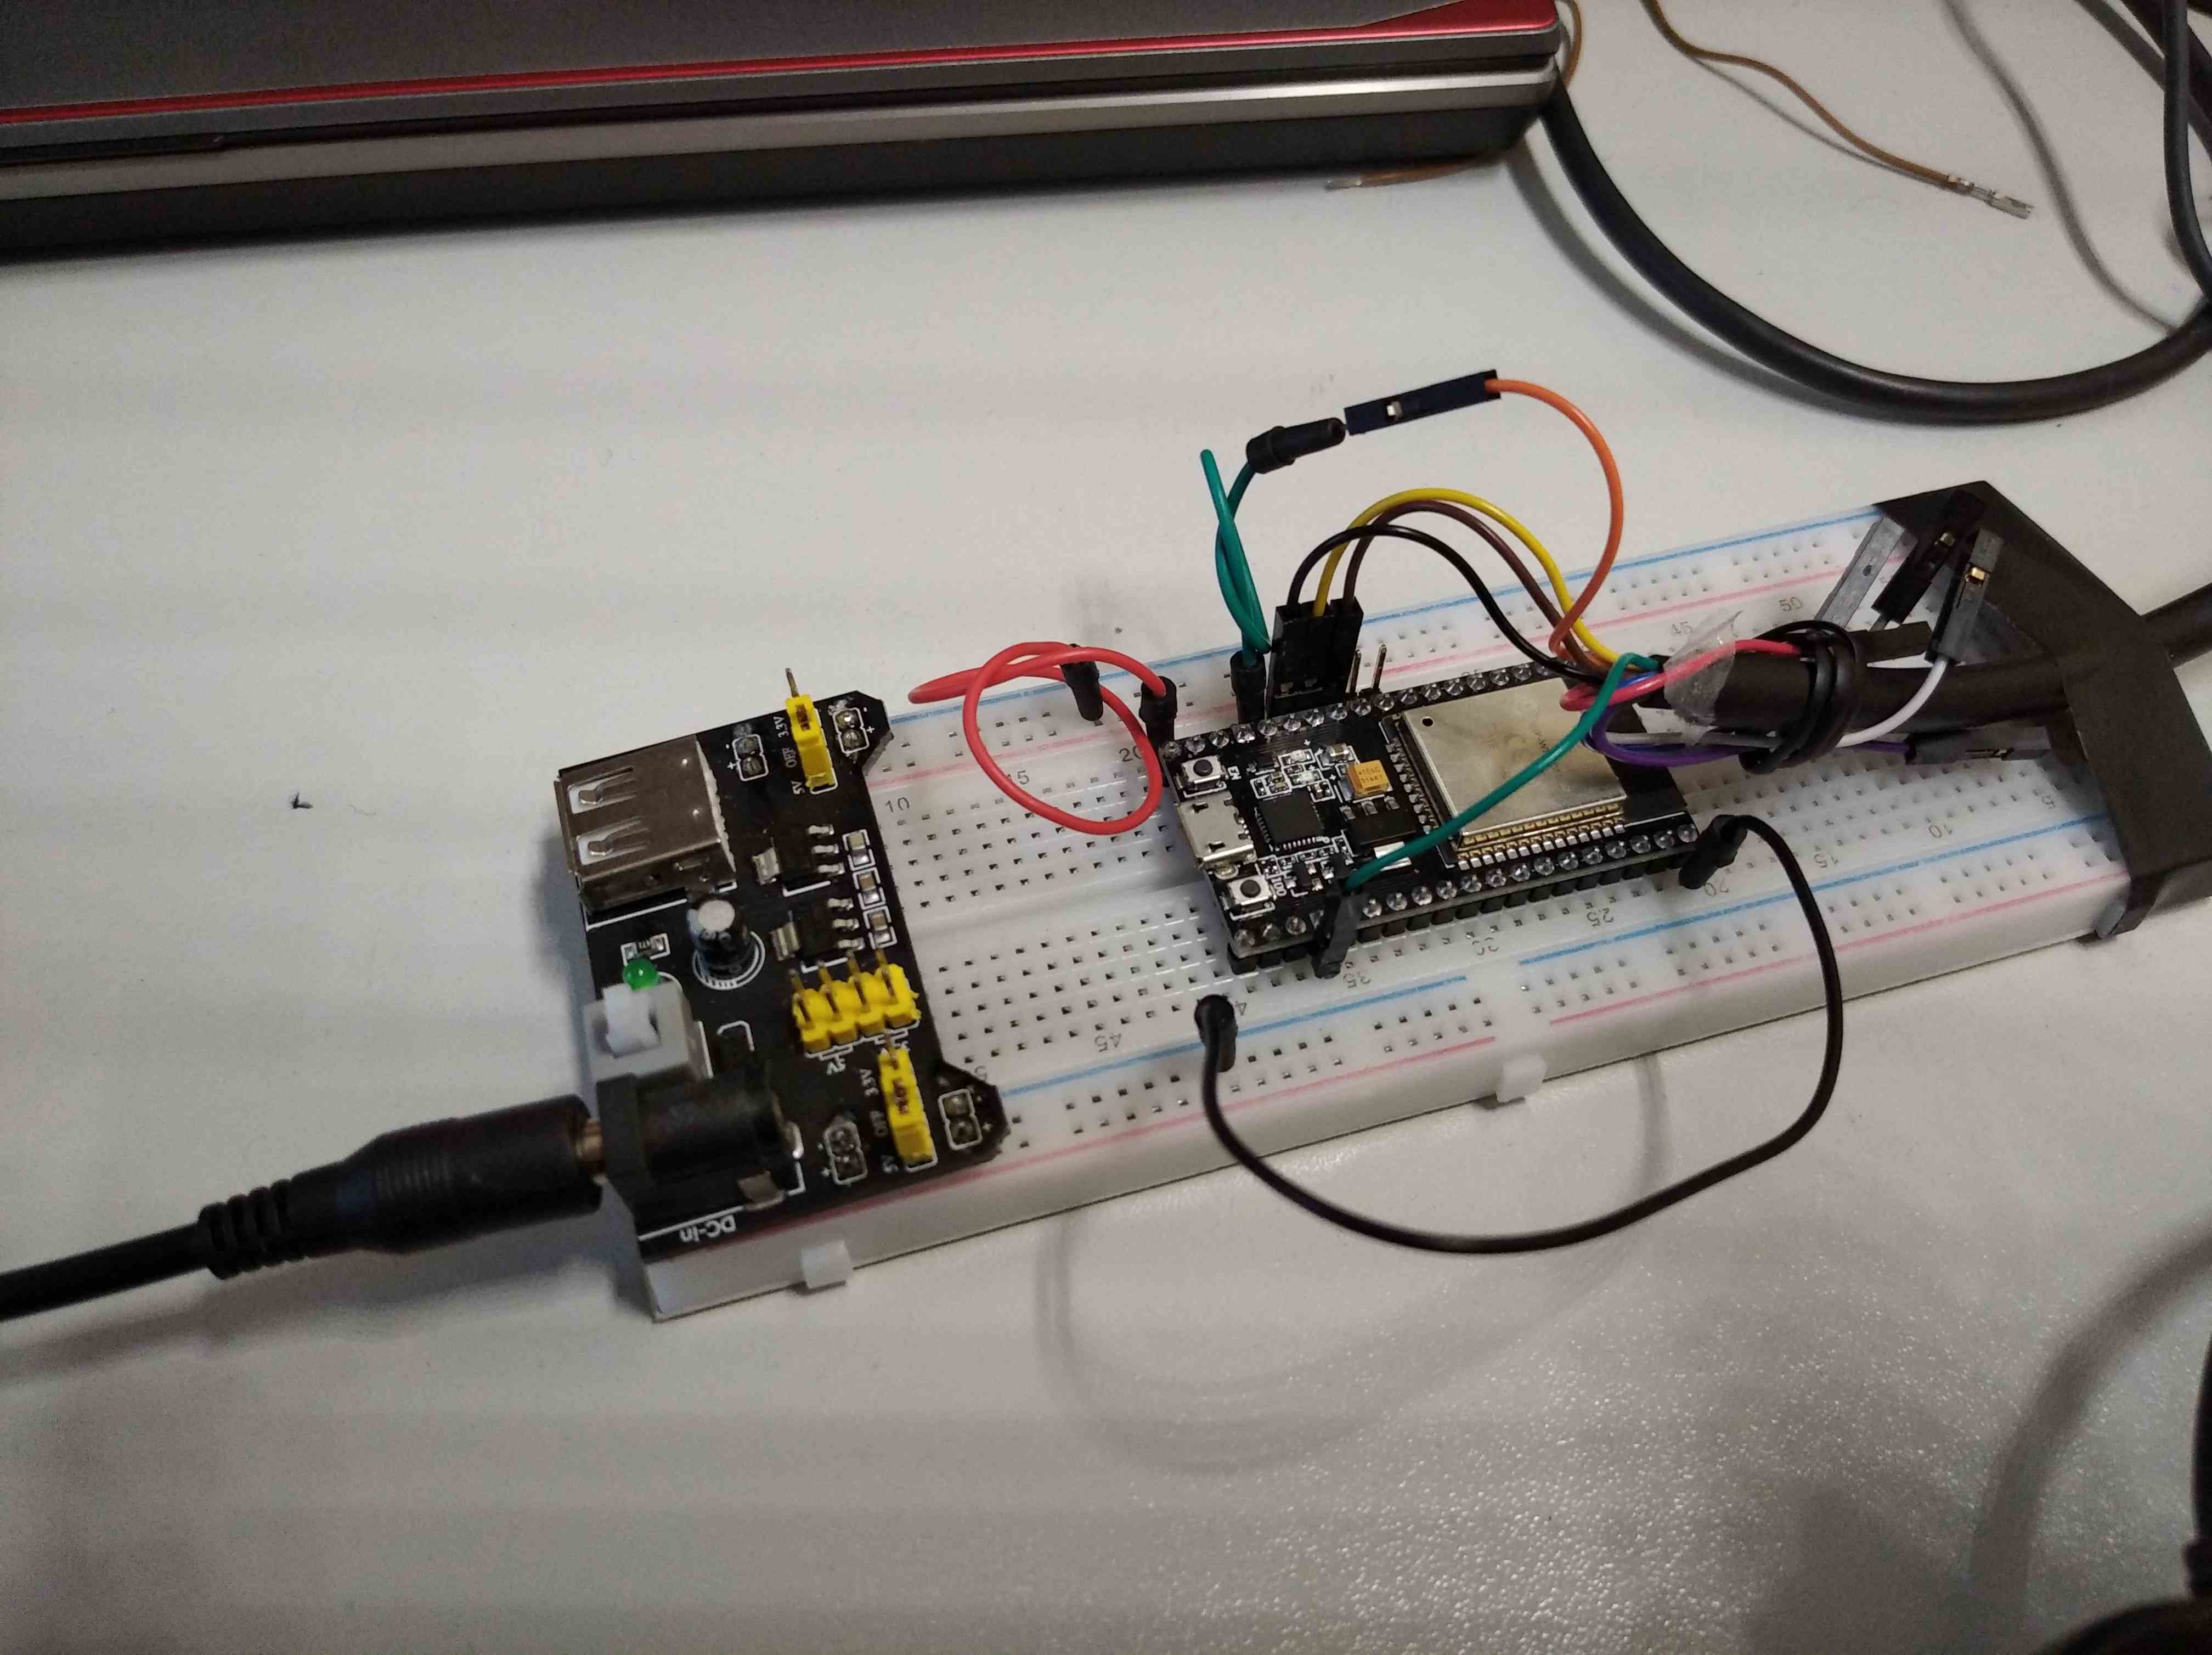
Other times I don’t and PIO debug sounds to be unstable. It seems related to communication between C232HM and ESP32.
I tried to slow down adapter_speed to 50Khz it doesn’t give any result.
I typical dump when it goes wrong:
Processing nodemcu-32s (platform: espressif32; framework: espidf; board: nodemcu-32s)
Verbose mode can be enabled via -v, --verbose option
CONFIGURATION: https://docs.platformio.org/page/boards/espressif32/nodemcu-32s.html
PLATFORM: Espressif 32 1.11.1 > NodeMCU-32S
HARDWARE: ESP32 240MHz, 320KB RAM, 4MB Flash
DEBUG: Current (custom) External (esp-prog, iot-bus-jtag, jlink, minimodule, olimex-arm-usb-ocd, olimex-arm-usb-ocd-h, olimex-arm-usb-tiny-h, olimex-jtag-tiny, tumpa)
PACKAGES: toolchain-xtensa32 2.50200.80 (5.2.0), framework-espidf 3.30300.190916 (3.3.0), tool-esptoolpy 1.20600.0 (2.6.0)
LDF: Library Dependency Finder -> http://bit.ly/configure-pio-ldf
LDF Modes: Finder ~ chain, Compatibility ~ soft
Found 0 compatible libraries
Scanning dependencies…
No dependencies
Building in debug mode
Retrieving maximum program size .pio\build\nodemcu-32s\firmware.elf
Checking size .pio\build\nodemcu-32s\firmware.elf
Advanced Memory Usage is available via “PlatformIO Home > Project Inspect”
DATA: [ ] 3.7% (used 12040 bytes from 327680 bytes)
PROGRAM: [= ] 14.9% (used 155828 bytes from 1048576 bytes)
========================= [SUCCESS] Took 22.12 seconds =========================
Reading symbols from d:\Users\Davide\Documenti\PlatformIO\Projects\200121-085425-espidf-blink.pio\build\nodemcu-32s\firmware.elf…
done.
PlatformIO Unified Debugger -> http://bit.ly/pio-debug
PlatformIO: debug_tool = custom
PlatformIO: Initializing remote target…
Open On-Chip Debugger v0.10.0-esp32-20190708 (2019-07-08-11:04)
Licensed under GNU GPL v2
For bug reports, read
http://openocd.org/doc/doxygen/bugs.html
adapter speed: 1000 kHz
Info : Configured 2 cores
esp32 interrupt mask on
Info : tcl server disabled
Info : telnet server disabled
Info : clock speed 1000 kHz
Info : JTAG tap: esp32.cpu0 tap/device found: 0x120034e5 (mfg: 0x272 (Tensilica), part: 0x2003, ver: 0x1)
Info : JTAG tap: esp32.cpu1 tap/device found: 0x120034e5 (mfg: 0x272 (Tensilica), part: 0x2003, ver: 0x1)
Info : esp32: Debug controller 0 was reset (pwrstat=0x5F, after clear 0x0F).
Info : esp32: Core 0 was reset (pwrstat=0x5F, after clear 0x0F).
Info : esp32: Debug controller 1 was reset (pwrstat=0x5F, after clear 0x0F).
Info : esp32: Core 1 was reset (pwrstat=0x5F, after clear 0x0F).
Info : Detected debug stubs @ 3ffc0340 on core0 of target ‘esp32’
Info : accepting ‘gdb’ connection from pipe
Error: No symbols for FreeRTOS
Error: cpu1: esp32_fetch_all_regs (line 303): DSR (80108413) indicates DIR instruction generated an exception!
Error: Exception reading excsave5!

Info : Target halted. PRO_CPU: PC=0x400E4292 (active) APP_CPU: PC=0x00000000
Error: cpu0: xtensa_write_memory (line 807): DSR (8000CC13) indicates DIR instruction generated an exception!
Warn : esp32: Failed writing 512 bytes at address 0x40091000, data - 1d, f0, 00, 00, 36, 41, 00, 91
Error: Failed to write stub section!
Error: Failed to load stub (-4)!
Error: Algorithm run failed (-4)!
Error: Failed to run flasher stub (-4)!
Warn : Failed to get flash mappings (-4)!
Error: cpu0: xtensa_read_memory (line 700): DSR (8000CC13) indicates DIR instruction generated an exception!
Warn : cpu0: Failed reading 5848 bytes at address 0x40090000
Error: no working area available, can’t alloc space for stub code!
Error: Failed to load stub (-308)!
Error: Algorithm run failed (-308)!
Error: Failed to run flasher stub (-308)!
Error: Failed to probe flash, size 0 KB
Error: auto_probe failed
Error: Connect failed. Consider setting up a gdb-attach event for the target to prepare target for GDB connect, or use ‘gdb_memory_map disable’.
Error: attempted ‘gdb’ connection rejected
Error: error during select: Unknown error
Info : Restore debug stubs @ 3ffc0340 on core0 of target ‘esp32’
Warn : Flash driver of esp32.flash does not support free_driver_priv()
Warn : Flash driver of irom does not support free_driver_priv()
Warn : Flash driver of drom does not support free_driver_priv()
.pioinit:13: Error in sourced command file:
Remote communication error. Target disconnected.: No error.
Does someone have any suggestion about waht happens?
Thanks.