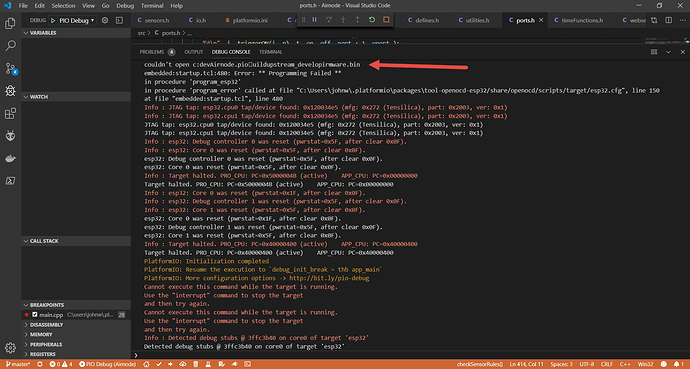
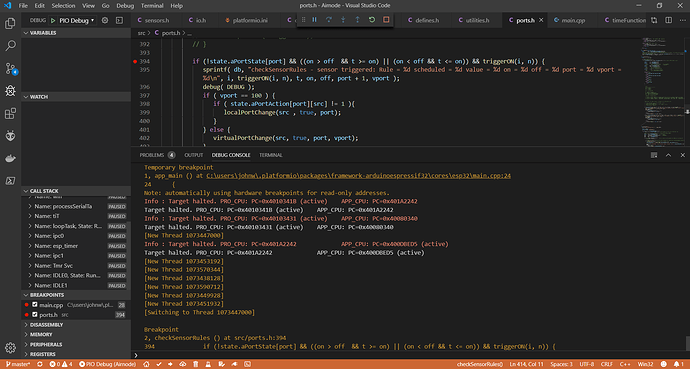
I’m trying to debug an RTC problem. I set a breakpoint and execution pauses, but the tool palette does not give the continue, step into, etc options. Only pause, and I’m already paused. I’m using the esp-prog debugging tool, ESP32 Arduino framework.
The breakpoint was not hit at this line and the processor is still running, so naturally step-over etc is not available. Are you putting too many breakpoints in the project? There are hardware limitations.
Why does the call stack say paused? Everything looks the same as when the “temporary breakpoint” gets hit.
And if that breakpoint didn’t get hit, why didn’t it? This is in the setup function. The functions I want to debug are inside that initRTC function but setting breakpoints in them works only sporadically.
And as you can see there is only 1 active breakpoint…
I’m not sure what “PAUSED” means in regards to that, but it does show the different RTOS threads, some of which may actually be “PAUSED” / sleeping. @ivankravets what’s the meaning of the label next to the threads?
You did restart the ESP after setting the breakpoint to make it execute setup() again right? About “sporadically”: Is this on a reference Espressif board (aka the WROVER-KIT) or your own hardware?
Yes, of course.
Posts from ESP32-arduino gitter (https://gitter.im/espressif/arduino-esp32) suggest that debugging using platformIO in vscode is buggy in general. But what a great tool if that was addressed and resolved!
Could you try to set brakepoints after debugging session started? I recommend doing a few “step over” until xCreateTask and then putting brakepoints in the main code.
Thanks for responding. I will try that this afternoon.
It’s no longer even getting to the initial breakpoint. And it’s dropping a “programming failed” message with a strange file path. I am uploading code via the COM port connector on this esp_prog - maybe that’s what the message is indicating, but it used to open main.cpp and pause. It’s not doing that now. I updated PIO last week so it should be the current version. Also note that there is a “Target halted message” but the pause button at the top is lit, indicating that everything is running. And I can see values changing on my device so it is in fact running.
Could you open PlatformIO IDE Terminal and type pio upgrade --dev. Restart VSCode. Does it work now?
Yes, that got it to stop at the initial breakpoint. I stepped over everything including the xtaskcreateuniversal call in main.cpp then set a breakpoint in a function that I know is running. It shows the breakpoint in the sidebar and main window but it’s not pausing.
Or maybe it is pausing - everything in the call stack is paused, but the pause button at the top is still lit and stepover/stepin functions are not available. And there is nothing in the variables pane, and I’ve set several variables in this function by this point… No, it’s not paused. I just saw movement.
Could you try this workflow Get started with Arduino and ESP32-DevKitC: debugging and unit testing — PlatformIO latest documentation ?
We need to wait some time while PlatformIO is initializing debug session, and we are ready to debug when the first line after the main function is highlighted.
- Please wait when debugging session is stopped at the first line of app_main() function
WARNING! - Please set breakpoint at void loopTask(void *pvParameters) (13 line on the screenshot below, this line can change between releases)
- Now, please press CONTINUE/RUN button on debugging toolbar (right arrow icon)
- Debugging session should stop at the first line of void loopTask(void *pvParameters) function
- Now, navigate to your Arduino setup/loop code and do classic debugging.
It worked!
It is important to add to all of the instructions that you must remove all breakpoints then reset each of these breakpoints one at a time AFTER the processing is paused at the previous breakpoint or debugging will not work.
Remove all breakpoints
Start Debugging
When it pauses at app_main -> add breakpoint at loopTask(void *pvParameters) -> CONTINUE/RUN
When it pauses at loopTask -> add breakpoint where you want to actually debug -> CONTINUE/RUN
Now you’re debugging.
Thanks for your help!
Great! I’m not sure that this is an issue of PlatformIO. It looks like there are problems with openOCD for ESP32.
It would be good if someone tests the same simple project on Eclipse following official Espressif documentation. If it works in Eclipse and does not work with VSCode, we will take a look. Thanks!
When I click “pause”, i have this error:
Program received signal
SIGINT, Interrupt.
[Switching to Thread 1073464192]
0x4017893e in esp_pm_impl_waiti () at /home/runner/work/esp32-arduino-lib-builder/esp32-arduino-lib-builder/esp-idf/components/esp32/pm_esp32.c:492
492  **/home/runner/work/esp32-arduino-lib-builder/esp32-arduino-lib-builder/esp-idf/components/esp32/pm_esp32.c: No such file or directory** .
Maybe I need reinstall platformIO ? Maybe VScode x64-version is not support debug? My OS is Win10x64 (LTSB)
I followed your instructions:
now the pause works, but “No such file or directory” confuses me:
Program received signal
SIGINT, Interrupt.
_frxt_int_enter () at /home/runner/work/esp32-arduino-lib-builder/esp32-arduino-lib-builder/esp-idf/components/freertos/portasm.S:119
119 /home/runner/work/esp32-arduino-lib-builder/esp32-arduino-lib-builder/esp-idf/components/freertos/portasm.S: No such file or directory.
Info : Target halted. PRO_CPU: PC=0x4017893E APP_CPU: PC=0x4017893E (active)
Target halted. PRO_CPU: PC=0x4017893E APP_CPU: PC=0x4017893E (active)Program received signal
SIGINT, Interrupt.
0x4017893e in esp_pm_impl_waiti () at /home/runner/work/esp32-arduino-lib-builder/esp32-arduino-lib-builder/esp-idf/components/esp32/pm_esp32.c:492
492 /home/runner/work/esp32-arduino-lib-builder/esp32-arduino-lib-builder/esp-idf/components/esp32/pm_esp32.c: No such file or directory.
This is perfectly normal. You have stopped in the FreeRTOS code, and the Arduino-ESP32 core links this in via the static precompiled library libfreertos.a (here). So if you stop in FreeRTOS code it will show the paths from when the library was compiled, and as you can see this library was built on some linux machine / automated build machine under the path /home/runner/work/. Since FreeRTOS is included as binary, you can’t debug it through source code but just assembly code.
Thus is this is not an “error” per-sé. Debugging your own code in source-code format works, right?
Thanks, yes. I would like to see in which particular task the pause occurred, but I will probably have to solve it in other ways
The used openocd version should be FreeRTOS thread aware. When you go into the debug console for typing GDB commands, does info threads show anything useful?
I pause, then continue step by step using various methods. And here is what I see in the console:
Program received signal
SIGINT, Interrupt.
[Switching to Thread 1073465604]
Info : Target halted. PRO_CPU: PC=0x400FA58C APP_CPU: PC=0x400916EE (active)
Info : Target halted. PRO_CPU: PC=0x400FA58C APP_CPU: PC=0x400916EE (active)
Info : Target halted. PRO_CPU: PC=0x400FA58C APP_CPU: PC=0x400916EE (active)
Info : Target halted. PRO_CPU: PC=0x400FA58C APP_CPU: PC=0x400916EE (active)
0x4017893e in esp_pm_impl_waiti () at /home/runner/work/esp32-arduino-lib-builder/esp32-arduino-lib-builder/esp-idf/components/esp32/pm_esp32.c:492
492 /home/runner/work/esp32-arduino-lib-builder/esp32-arduino-lib-builder/esp-idf/components/esp32/pm_esp32.c: No such file or directory.
Warn : xtensa_add_breakpoint: max HW slot reached, slot=2
Info : Target halted. PRO_CPU: PC=0x400FA58C APP_CPU: PC=0x400916EE (active)
Warn : xtensa_add_breakpoint: max HW slot reached, slot=2
Info : Target halted. PRO_CPU: PC=0x400FA58C APP_CPU: PC=0x400916EE (active)
Warn : xtensa_add_breakpoint: max HW slot reached, slot=2
Info : Target halted. PRO_CPU: PC=0x400FA58C APP_CPU: PC=0x400916EE (active)
Warn : xtensa_add_breakpoint: max HW slot reached, slot=2
Info : Target halted. PRO_CPU: PC=0x400FA58C APP_CPU: PC=0x400916EE (active)
Info : Target halted. PRO_CPU: PC=0x400FA58C APP_CPU: PC=0x400916EE (active)
Info : Target halted. PRO_CPU: PC=0x400FA58C APP_CPU: PC=0x400916EE (active)
Info : Target halted. PRO_CPU: PC=0x400FA58C APP_CPU: PC=0x400916EE (active)
Info : Target halted. PRO_CPU: PC=0x400FA58C APP_CPU: PC=0x400916EE (active)
In the code, the transition to assembly instructions is displayed. Perhaps this is due to the fact that I get to the moment when the CPU is not loaded with anything, but how do I get into the next task? Continue to click “next step”? Or maybe there is a way to skip the delay () / OSdelay () step?
If openocd recognized the FreeRTOS tasks as threads you can also use it to switch to a certain thread using thread <num> (see Debugging with GDB - Threads)
Generally you should set breakpoints in a task’s main function loop if you want to debug this task, because other tasks will most likely be in some FreeRTOS internal code like vTaskDelay or semaphore stuff etc. You should still be able to use return or “return from function” debug button to step out of that function until you are in user code again.
The problem is that breakpoints stop the CPU, and unlike STM32 for example, where it comes instantly, you need to wait a few seconds. VScode allows you to set “log points”, execution does not stop at these points, it just writes to the log. But they do not work properly, is this a flaw in platformio?
Thanks for the link, I’ll try to figure out how to “skip” the current thread, because I started all the debugging in order to understand what happens in emergency situations, when part of the tasks stops working for me

