Okay then!!
Tried with the mbed blinky and upload_tool=bmp and atom throws an error that bmp is an unrecognised tool.

I am unable to start debugging at all with the BMP and mbed code. It compiles fine and uploads fine using BMP. But no for debugging.
@Robert_Walli I am assuming that you tried debugging with the St-link bundled with the nucleo boards.
In such a case, I think the issue lies with the mbed compilation. Since neither of the debuggers BMP and St-Link are able to debug. Can you post the code that you are trying to debug. Also, is there a chance you have inadvertently declared one of the SWD pins as GPIO or some other functionality??
@ivankravets I am assuming you are using Mbed-cli and arm-none-eabi-gcc for the code compilation. Maybe there is a flag there that is playing havoc.
These posts
https://developer.mbed.org/questions/3996/Nucleo-F401RE-SWD-ERROR-problem/
https://developer.mbed.org/questions/3908/Cannot-loaddebug-NUCLEO-401RE-with-uVisi/
https://developer.mbed.org/questions/973/SWD-error/
seems to indicate that even the mbed and/or st-link is disabling the SWD functionality, or at the very least is inconsistent. I ll need to familiriaze myself with the mbed compilation process and start troubleshooting it.
Yes, and debugging is working!
Only the gui output is very limited.
I tried to debug the mbed-blink-example and i have no output in the main function.
BUT: when I “step into” functions I can examine the variables.
Here - as an example - the “wait-function”:
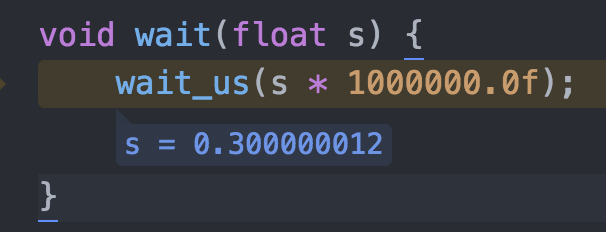
(sorry for the image, but otherwise the s=0.30000012 is not visible)
Nice!! 
Now we know st-link works with the mbed.
Try incrementing a counter in the main loop for each iteration of the blink_led and see if that shows up in the watch window.
That’s the the reason of my posting and the first thing i tried out:
If you define the loop counter globally or within the main function, it’s not visible in the debug window.
I have even tried to increment the counter in a sub function but it’s not visible.
A gdb-commandline would be great.
hmm…
thats funny… I faced the same issue but my brain did not register the fact till you pointed it out.
I ll try manually debugging the same code using command line gdb from the terminal and report back.
can you give me a small hint how to start gdb within platformio?
Well, the brute force way is to simply toggle the terminal by pressing
CTL + ~
which will start a terminal in the current project base folder. Then you can manually invoke the gdb binary from the .platformio folder.
On Mac it is under /Users/(Username)/.platformio/packages/toolchain-gccarmnoneeabi/bin.
It will start the gdb session and you can debug away happily. but it is not elegant and is kinda a hack.
Starting gdb is not the problem, but i don’t know how to configure gdb (connect to target, load binary…)
Did it work for you?
sure…
Most of the gdb commands are pretty similar. Shouldnt be much of a problem from tool to tool.
There will be slight differences but not too different.
My gdb command set for flashing the bluepill board is this.
target extended-remote /dev/cu.usbmodemBFDEA5F1
monitor swdp_scan
attach 1
load
quit
yes
the “/dev/… section” is the gdb server connection of the BMP,
the “monitor swdp_scan” scans for all devices on the SWD chain.
“attach 1” attaches the debugger to the first device in the discovered chain.
load flashes the firmware binary to the attached device and quits the gdb connection
It might seem a little bit daunting as first, but it is pretty easy once you get the hang of it.
Try --help for the gdb to get a list of all the commands. Try google for “St-link + gdb” or ""St-link + openocd"
to get a more detailed understanding.
Start off with debugging outside of platformio and then emulate the same from within. It is going to be very confusing if you try to achieve both at once. Reduce the number of unknowns and variables for you to work.
I could not get this working, but had success connecting to openocd with “target remote localhost:3333”.
Here I can see all variables.
It seems to be only an GUI problem…
Please sorry, we hear you. The main aim of PIO IDE is GUI/UX. Not matter how PIO Core is powerful. If a user has a problem with GUI/UX, we should fix it.
Hello guys,
I have read your conversation; I am also trying to debug with PIO.
I am using an ST-Link V2 probe.
I have started gdb, but it is not supported by this target using “monitor swdp_scan”.
<http://www.gnu.org/software/gdb/bugs/>.
(gdb) monitor swdp_scan
"monitor" command not supported by this target.
(gdb) --help
Undefined command: "--help".  Try "help".
(gdb) help
List of classes of commands:

aliases -- Aliases of other commands
breakpoints -- Making program stop at certain points
data -- Examining data
files -- Specifying and examining files
internals -- Maintenance commands
obscure -- Obscure features

running -- Running the program
stack -- Examining the stack
status -- Status inquiries
support -- Support facilities
tracepoints -- Tracing of program execution without stopping the program
user-defined -- User-defined commands

Type "help" followed by a class name for a list of commands in that class.
Type "help all" for the list of all commands.
Type "help" followed by command name for full documentation.
Type "apropos word" to search for commands related to "word".
Command name abbreviations are allowed if unambiguous.
What else should I try to run step by step?
What is your board? Could you share platformio.ini?
Sure, here it is:
[env:genericSTM32F103CB]
platform = ststm32
board = genericSTM32F103CB
framework = arduino
upload_protocol = stlink
build_flags = -v -D SERIAL_USB -D GENERIC_BOOTLOADER -D CONFIG_MAPLE_MINI_NO_DISABLE_DEBUG=1
@krishna_chaitanya , @stevestrong , @Robert_Walli , please remove any build flags from platformio.ini and update ST STM32 development platform. pio platform update.
Now, debug should work without extra any steps.
@krishna_chaitanya , please set debug_tool = blackmagic, PIO should detect debug port automatically.
Well, it is still asking for the debug_port. It is throwing an error without defining the debug_port.
Other than that it works just fine…
Could you provide an output of pio device list ? Do you /dev/cu.usbmodemBFDEA5F1 in this list?
Sorry @ivankravets, that was with the older version of gdb for debugging.
The latest version works just fine!!
Wonderfully so infact!!
Do you mean, that now it works with “simple” platformio.ini? You don’t specify build flags, debug port, etc?
It should work automatically without extra configuration.
I have used it with the same configuration specifying the debug_ports and all. I did not change to a “simple” platformio.ini. From what I can read and understand from the board json files, the -DCONFIG_MAPLE_MINI_NO_DISABLE_DEBUG=1, DEBUG_PORT and other small issues still need to be specified.
As a matter of fact, I am trying to refine a set of gdb commands to add to the debug_gdbinit section of the platformio.ini file. It works as you said, I am trying to arrive at a comfortable workflow for a test project.
