AVR simulator as aid tool for debugging code

@valeros
This is the procedure to launch the debug session on CLI mode, right?
Could you upload the source code you are using? My demo returns this for disassemble main

0x0000044c < 0>: call 0x220 ; 0x220
0x00000450 < 4>: call 0x38c ; 0x38c
0x00000454 < 8>: call 0x358 ; 0x358
0x00000458 < 12>: ldi r24, 0x00 ; 0
0x0000045a < 14>: ldi r25, 0x00 ; 0
0x0000045c < 16>: or r24, r25
0x0000045e < 18>: breq .-12 ; 0x454 <main 8>
0x00000460 < 20>: call 0 ; 0x0 <__vectors>
0x00000464 < 24>: rjmp .-18 ; 0x454 <main 8>

This is the procedure to launch the debug session on CLI mode, right?

Yes, that’s one of the options or you can type commands directly in the debug console.

My demo returns this for disassemble main

I see, it looks like the load command is mandatory even if the firmware didn’t change.

But what’s interesting is that when I specify a memory range it still returns NOPes, e.g.:

(gdb) disassemble main
Dump of assembler code for function main:
=> 0x000008ca <+0>:     call    0x24e   ;  0x24e <init>
   0x000008ce <+4>:     call    0x74a   ;  0x74a <setup>
   0x000008d2 <+8>:     call    0x7d2   ;  0x7d2 <loop>
   0x000008d6 <+12>:    call    0x732   ;  0x732 <serialEventRun>
   0x000008da <+16>:    rjmp    .-10            ;  0x8d2 <main+8>
End of assembler dump.
(gdb) disassemble 0x000008ca,0x000008da
Dump of assembler code from 0x8008ca to 0x8008da:
   0x008008ca:  nop
   0x008008cc:  nop
   0x008008ce:  nop
   0x008008d0:  nop
   0x008008d2:  nop
   0x008008d4:  nop
   0x008008d6:  nop
   0x008008d8:  nop
End of assembler dump

@valeros
Look at the addresses. While you ask for 0x000008ca, which is in the flash section so is good, GDB returns 0x8008ca. That 8 shouldn’t be there and the returned memory is outside the program region. By default that memory is empty, that’s why we have nop.
I haven’t figured why GDB is doing that yet. Do you have any idea?

Edit: I’ve found and old comment from the author himself related to this problem. That lead me to research about the memory mapping in avr-gdb and looks like there is a very well known bug. I found a patch but it never got into avr-gdb mainline.

@ivankravets
We need that fix to get the disassemble command working properly. Would it be possible to recompile avr-gdb with that patch? As this only affects avg-gdb it shouldn’t have any effect over avr-gcc, so Arduino compatibility should stay the same.

2 Likes

Could someone helps us with updated binaries?

This patch definitely works. I compiled GDB 9.1 from Index of /gnu/gdb, applied the source change, compiled (./configure --target=avr --prefix=<some_local_install_dir> && make && make install procedure) and it goes from previously

disassemble main
Dump of assembler code for function main:
   0x00000496 <+0>:     call    0x280   ;  0x280 <init>
   0x0000049a <+4>:     call    0x3d6   ;  0x3d6 <setup>
   0x0000049e <+8>:     call    0x3b8   ;  0x3b8 <loop>
   0x000004a2 <+12>:    ldi     r24, 0x00       ; 0
   0x000004a4 <+14>:    ldi     r25, 0x00       ; 0
   0x000004a6 <+16>:    or      r24, r25
   0x000004a8 <+18>:    breq    .-12            ;  0x49e <main+8>
   0x000004aa <+20>:    call    0       ;  0x0 <__vectors>
   0x000004ae <+24>:    rjmp    .-18            ;  0x49e <main+8>
End of assembler dump.
{"token":55,"outOfBandRecord":[],"resultRecords":{"resultClass":"done","results":[]}}
disassemble 0x496,0x4ae
Dump of assembler code from 0x800496 to 0x8004ae:
   0x00800496:  nop
   0x00800498:  nop
   0x0080049a:  nop
   0x0080049c:  nop
   0x0080049e:  nop
   0x008004a0:  nop
   0x008004a2:  nop
   0x008004a4:  nop
   0x008004a6:  nop
   0x008004a8:  nop
   0x008004aa:  nop
   0x008004ac:  nop
End of assembler dump.

to

disassemble 0x496,0x4ae
Dump of assembler code from 0x496 to 0x4ae:
   0x00000496 <main+0>:	call	0x280	;  0x280 <init>
   0x0000049a <main+4>:	call	0x3d6	;  0x3d6 <setup>
   0x0000049e <main+8>:	call	0x3b8	;  0x3b8 <loop>
   0x000004a2 <main+12>:	ldi	r24, 0x00	; 0
   0x000004a4 <main+14>:	ldi	r25, 0x00	; 0
   0x000004a6 <main+16>:	or	r24, r25
   0x000004a8 <main+18>:	breq	.-12     	;  0x49e <main+8>
   0x000004aa <main+20>:	call	0	;  0x0 <__vectors>
End of assembler dump.

Though I seem to have made some mistake while compiling regarding python because GDB keeps complaining about

Python Exception <type 'exceptions.NameError'> Installation error: gdb._execute_unwinders function is missing: 

so it doesn’t make sense to share the binary. But the patch is correct.

2 Likes

@maxgerhardt
Great! Really baffling that they never fixed that bug after all this time. Looks like avr-gdb really is a very low priority for them.

@valeros
I’ve found an interesting workaround. It would help to test things until we get a correct binary.
Instead of this:

disassemble 0x000008ca,0x000008da

Use this:

disassemble (void (*)())0x000008ca, (void (*)())0x000008da

It should return the data on Flash memory instead of SRAM.

1 Like

@valeros @maxgerhardt
Any news regarding that binary?

I’ve started to eval another method to debug AVR microcontrollers, this time using the real hardware and a library without requiring any external tools. Works pretty well, almost as good as simavr, but disassemble has the same problem. I will open a new threat explaining how to use it soon.

1 Like

@msquirogac Still in progress, turns out it’s not quite easy to statically compile a proper self-sufficient GDB that doesn’t depend on external shared libraries.

Hi, I got some news.

I’ve been thinking about the capabilities of simavr that aren’t still supported, like the VCD dumps. I found that not only gtkwave support those files, but also the sigrok suite, which is an amazing tool for debugging electronic systems by looking at the signals they generate.

Now, to make simavr generate those VCD files, some parameters must be passed first, and right now there are only two ways to do it.

The first and most documented way requires passing the elf file directly to simavr as this:

simavr -m atmega328p -f 16000000 .pio/build/nanoatmega328new/firmware.elf

Then, add a block like this example into source code:

#include <avr_mcu_section.h>
AVR_MCU(F_CPU, "atmega328");
const struct avr_mmcu_vcd_trace_t _mytrace[]  _MMCU_ = {
	{ AVR_MCU_VCD_SYMBOL("TX"), .mask = (1 <<2), .what = (void*)&PORTD, }
};

Also the following must be added to platformio.ini

build_flags =
        -Wl,--undefined=_mmcu,--section-start=.mmcu=0x910000

Once done a file with the vcd extension should appear which can be open with this command:

pulseview -I vcd -i capture.vcd

The second method requires neither the library or the build_flags and is easier to set up, but
like the previous one a parameter that must be added to the simavr call. Said command isn’t documented and I just found about it by reviewing its source code. It goes this way:

simavr -m atmega328p -f 16000000 --add-vcd-trace name=kind@addr/mask

Where:
name is a tag that will be used to identify the trace.
kind is related to the AVR_MMCU_TAG_VCD_IRQ, AVR_MMCU_TAG_VCD_TRACE and AVR_MMCU_TAG_VCD_PORTPIN macros and should be trace for what matters.
addr and mask are the memory region and bit mask for the data being traced, and they are expressed in hex, being the former 16bits and the latter 8bits long.

So the call equivalent to the first example would be like this:

simavr -m atmega328p -f 16000000 --add-vcd-trace TX=trace@0x002B/0x04

It should be noticed that both ways give the simulator the same kind of information about the memory that we want to be traced, and both of them require extra parameters for the simavr call, yet only the first one requires the extra compilation flags and code modification.

Now, what is so amazing about sigrok and that VCD file that might be worth the hassle of setting all of that?

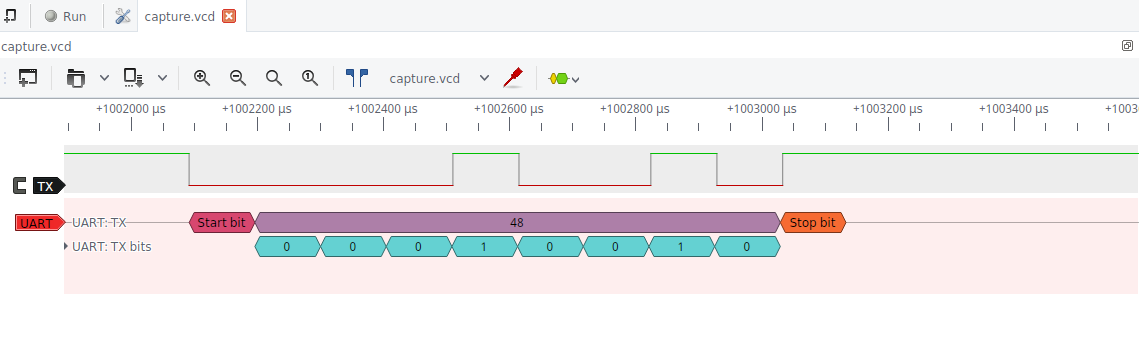
The VCD dump has information of all the transitions or changes in the traced memory region as if a tool like a logic analyzer or oscilloscope was connected, but as is a simulated system it isn’t limited to just an IO pin, but it can trace everything even regular variables.

On the other hand, sigrok not only can show those changes but also decode them, so you can see all the bits, their timing, and meaning. A picture is a better way to show this :slight_smile:

@valeros @ivankravets
Is there any way to pass additional arguments to the simavr call?
If not, would it be possible to create an option in the platformio.ini file? Something like debug_extra_args maybe.

1 Like

Some news,
I’ve coded a python script that can be called through the extra_scripts parameter, like this:

platformio.ini

[env:nanoatmega328new]
platform = atmelavr
board = nanoatmega328new
extra_scripts = capture_target.py
custom_capture =
    --add-vcd-trace
    LED=trace@0x0025/0x20

Said script automatizes most of the procedure described before, like adding the linker flags, or passing the parameters to the simulator. It also adds a new parameter called custom_capture which can be used to pass arbitrary arguments to simavr in capture mode, included the --add-vcd-trace parameter, making it possible to use both methods of describing the memory to be traced.

Must be noticed that this doesn’t replace the debug target, but creates a new one that can be invoked with:

pio run -t capture

Once done the file capture.vcd should appear with all the traces previously defined. Right now the only way to stop the capture is to CTRL+C it, and I wouldn’t advise to keep it recording for too long, especially for signals that change very fast, KHz and above range, because the file size can grow very quickly to tens or hundreds of MBytes.

Finally, I created a new repository for this tool and others related to enhance the integration of simavr into platformio. Right now, said script is available together with a modified version of the header avr_mcu_section.h, which forces the compiler not to drop the .mmcu section required for the simulator, and of course an example to make it easier to this idea.

Any feedback would be welcome, I would like to make this platformio-simavr integration even more amazing than what already is.

2 Likes

@valeros
Great news!!
The patch we talked before has just been accepted. mailing list
So now that its official, I suppose it’s just a matter of time until Microchip releases a new version with the fix included. :slight_smile:

2 Likes

lol… it only took …um, well, … 9 years, and that’s with the fix provided 5 years ago… :open_mouth: :laughing:

So there’s hope for other bugs yet! :bug:

Hi all, I just wanted to follow-up on the current status :slight_smile: As a not-very-familiar-with-platformio hobby dev notoriously setting up far-too-complex-for-my-skill-projects, I’m in desparate need for a working debugger solution (I would have taken my Atmel ICE if it worked with Arduino Nano…) While I can build my solutions with simavr tool in platformio, I would have expected to see live DDRx and PORTx registers (and almost all other periperal registers like serial buffer etc.) implemented off the shelf which is not the case.
So here my questions: What is the current status of implementation? How does platformio connect with simavr to handle these things?

Post 33 from @msquirogac was somewhat enlightening but this just creates a side-simavr solution which again I couldn’t get “live”.

1 Like

Hm good question. Usually the internal register map of a microcontroller is specified in SVD files which the PlatformIO unified debugger can load and then display the current value of it. This is indeed working already working, see screenshot and that little section “PERIPHERALS” – that info was decoded from the .svd file and the current value of that was captured using the gdb client.

But SVD files are mostly an ARM microcontroller type thing, and Atmel provides atdf that describe their hardware registers (per this). This is a project that can convert these files to SVD files though, and it supports the atmega328p – haven’t tried it yet or seen the corresponding SVD file though.

The way it internally works for the SVD files is that the board definition declares the path to the file

which maps e.g. to the file found in platform-atmelsam/misc/svd at develop · platformio/platform-atmelsam · GitHub in this case. But GitHub - platformio/platform-atmelavr: Atmel AVR: development platform for PlatformIO has no such SVD files.

If that file is obtained and referenced in the e.g. uno.json file, it’s half the story. The other is whether the current version of the PlatformIO Unified debugger will load the SVD file correctly, and whether avr-gdb will spit out the correct value for a certain register, if asked for. AVRs have a different memory architecture (harvard, I/O registers live in data memory and not in program memory), if the debugger asks GDB the wrong way for the value of a register address, it might get garbage or crash.

Also, I wanted to try out dwire since reports on that in VSCode PIO debugger for AVR - #9 by fedex03 of it partially working, I’m gonna give this a spin in combination with SVD files.

If it works, it means we have live-debugging of a running chip via debug-wire (the NRST line abused as bi-directional data line for debugging) with a decoded register view.

Note that currently also avr-stub works, but it inherently needs the main serial to communicate and it also needs flash space. But a working live-example of that can be seen in How to debug on Arduino mega 2560 - #2 by maxgerhardt.

Edit:

But that does work with avarice as a debugging server, doesn’t it? So, you can get live-debugging with that, too. See CLion / Avarice debug not working

1 Like

OMG so many options I can still try xD I sure find some time this evening to follow down these paths.

THIS would be AS GOOD AS Atmel Studio which I would then instantly ban from my machine. The only features that Atmel Studio do better in my opinion are debugging and easy chip config (erase chip, set fuses, automatic programmer detection) which are a bit more handy to perform there…

Ok, so what’s currently missing most is that .svd file, and that’s both for simavr and for live debugging using debugWire.
After a quick look into the repo and the implementation in crates.io, I must admit that my geek-level is not high enough to create these files myself, let alone implementing this in platformio’s JSON files. But I’d be keen to help, so if anybody is about to take on this challenge I’d be happy to support, help finding bugs, and to be one of the first to see the “PERIPHERALS” section alive for simavr and debugwire stuff on atmega328p!

Hm, getting closer…

I’ve used a Linux VM to install rustup, installed rust-nightly and then executed the build instructions and out popped the SVD files.

Added them all in the platform/atmelavr/misc/svd folder and referenced them in the board file, and during debugging it attemps to load them but fails.

Not 100% sure if the parser is broken or the generated SVD file. But I can at least file a PR now that adds the SVD files as a first step.

Edit: Huh interesting, when I feed the SVD file into CLion it can enumerate it just fine…

will have another play with it…

Edit: So close yet so far. CLion can parse the SVD file, but it seems it can’t get the values for the I/O registers through avr-gdb. Some values are working though.

As said I’ll create a PR and issue.

Done in Add SVD files for ATMega chips by maxgerhardt · Pull Request #238 · platformio/platform-atmelavr · GitHub and SVD Parser fails for ATMega files with "TypeError: Cannot read property '0' of undefined" · Issue #2368 · platformio/platformio-vscode-ide · GitHub

2 Likes

@msquirogac
I have been able to get the VCD file generation (and input) to work with the pio run command, but it does not appear to be a way to doing this in an interactive debug session. Any thoughts on this?

I’m trying to use simavr with platformio with the examples that @msquirogac provided. So far everything works fine. However, I would really like to simulate data coming from peripherals (e.g. accelerometer, rotary encoder, i2c etc.). I looked at the “tests” from the simavr github library, however none of those seem to simulate pin changes. Does anyone know how to do this?