Thanks. It’s slightly closer. I can now use minimodule by modifying mbftdi.cfg in .platformio\packages\tool-openocd-esp32\share\openocd\scripts\interface\ftdi as follows…
This gets me this far…
Checking size .pioenvsesp32devirmware.elf
Memory Usage → Redirecting...
DATA: [ ] 4.1% (used 13404 bytes from 327680 bytes)
PROGRAM: [= ] 13.5% (used 177060 bytes from 1310720 bytes)
Configuring upload protocol…
AVAILABLE: esp-prog, esptool, minimodule, olimex-arm-usb-ocd, olimex-arm-usb-ocd-h, olimex-arm-usb-tiny-h, olimex-jtag-tiny
CURRENT: upload_protocol = esptool
Looking for upload port…
Auto-detected: COM13
Uploading .pioenvsesp32devirmware.bin
Serial port COM13
Connecting…………………_____
A fatal error occurred: Failed to connect to ESP32: Timed out waiting for packet header
*** [upload] Error 2
[ERROR] Took 39.19 seconds
I’ve managed to upload the firmware to the esp32 board ok by setting upload_port to point to the usb serial port for the ESP32 board instead of the minimodule, but the debugger then stalls still. I think I need to go back and check the wiring, but atleast I can now get past the PID issue without resorting to the custom command
Thanks - think it’s closer but I get this error with either protocol and port…
PlatformIO Unified Debugger > Redirecting...
PlatformIO: Initializing remote target…
Open On-Chip Debugger 0.10.0-dev (2018-06-04-09:51)
Licensed under GNU GPL v2
For bug reports, read OpenOCD: Bug Reporting
adapter speed: 20000 kHz
esp32 interrupt mask on
force hard breakpoints
Info : tcl server disabled
Info : telnet server disabled
Error: libusb_open() failed with LIBUSB_ERROR_NOT_SUPPORTED
Info : ftdi: if you experience problems at higher adapter clocks, try the command “ftdi_tdo_sample_edge falling”
Info : clock speed 20000 kHz
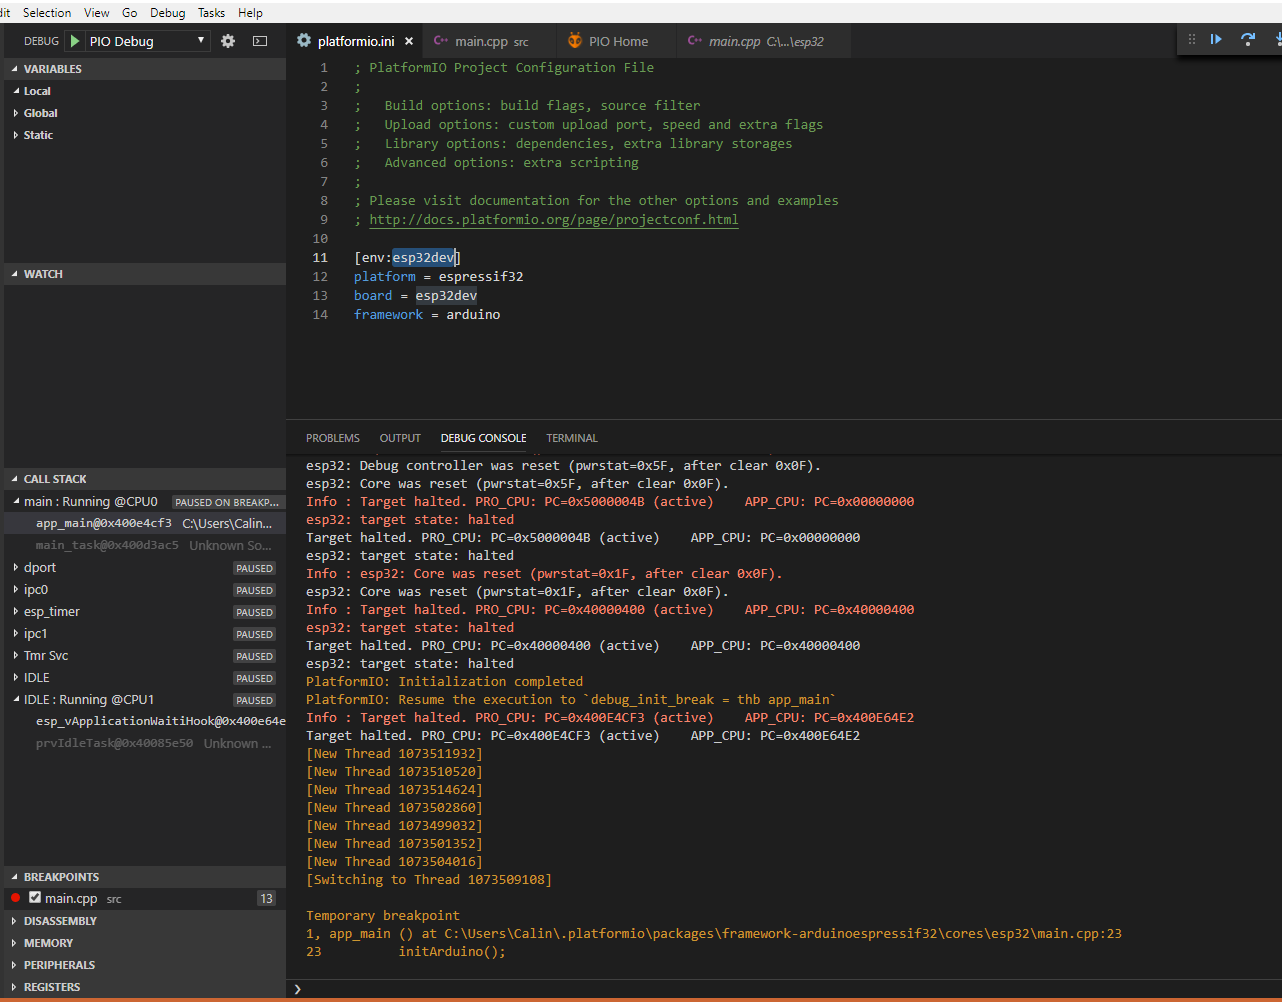
Ok, so the error is gone and it looks like it’s better, but I don’t anything happening further than this.
I’ve set some break points in the GUI. They don’t seem to be getting hit.
Tried changing the layout parameter and no difference.
Would I see errors if the wiring wasn’t correct? Is there a command I can put into the terminal or debug switch I can use to get more info on what’s happening?
Thanks for your help so far,
Andy.
…
Writing at 0x0000e000… (100 %)
Wrote 8192 bytes (47 compressed) at 0x0000e000 in 0.0 seconds (effective 9362.3 kbit/s)…
Hash of data verified.
Compressed 177216 bytes to 88964…
Writing at 0x00010000… (16 %)
Writing at 0x00014000… (33 %)
Writing at 0x00018000… (50 %)
Writing at 0x0001c000… (66 %)
Writing at 0x00020000… (83 %)
Writing at 0x00024000… (100 %)
Wrote 177216 bytes (88964 compressed) at 0x00010000 in 1.8 seconds (effective 768.4 kbit/s)…
Hash of data verified.
Leaving…
Hard resetting via RTS pin…
[SUCCESS] Took 8.02 seconds
Reading symbols from c:/Users/Andy.ASUS/Documents/PlatformIO/Projects/DebugTest2/.pioenvs/esp32dev/firmware.elf…
done.
PlatformIO Unified Debugger > Redirecting...
PlatformIO: Initializing remote target…
Open On-Chip Debugger 0.10.0-dev (2018-06-04-09:51)
Licensed under GNU GPL v2
For bug reports, read OpenOCD: Bug Reporting
adapter speed: 20000 kHz
esp32 interrupt mask on
force hard breakpoints
Info : tcl server disabled
Info : telnet server disabled
Info : ftdi: if you experience problems at higher adapter clocks, try the command “ftdi_tdo_sample_edge falling”
Info : clock speed 20000 kHz
Make sure the debug lines (TDI,TDO,TMS,TCK,TRST, GND) are connected correctly.
You can try the console command"pio debug --interface gdb -x .pioinit" to start gdb and connect to target.
I don’t seem to be able to make any further progress. I’m using an ESP32 dev board based on the WROOM32 package. I’ve double checked the wiring and it seems to be correct. I’ve tried all 4 ports as listed in device manager and get the same results for each. Tried the layout value you have suggested. Only other thing I can think is to run up the logic analyser tomorrow and take a look at the signals to see what is happening.
Yep.
That’s it
I think will be much easier to edit the “ftdi_vid_pid 0x0403 0x6010” line on esp32_devkitj_v1.cfg
Then you won’t need fancy options on platformio.ini
I can debug esp32 project with ftdi based jtag using just this options on platformio.ini:
I meant debug on openocd itself. I still don’t seem to have it working as it just seems to stall at that point and never halts the program at any breakpoint I’ve added and doesn’t display anu of the debug info. I’ve ordered a different interface in case this one is a problem
Ok, I finally have it working. I missed one set of power loop connections on the miniboard that are more clearly documented here:
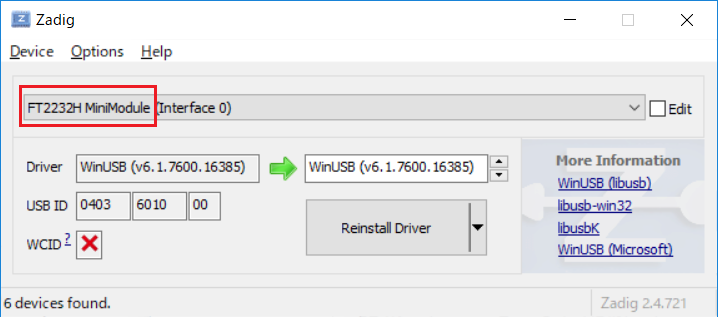
Missing these connections has the bizarre result that the FT2232H miniboard is detected as an FT4232H miniboard! So, it really leads you up the garden path. Now I have these loop cables in place, the driver correctly identifes the 2 ports and my config is now very simple. Thanks for your help, I’ve learnt a lot more about how this stuff all hooks together
I was also mistakenly wiring the FT2232H minimodule.
As wired as documented, the driver correctly recognized FT2232H(vid 0403,pid6010).
I replaced the driver with zadig, but an same error occurred.
Error: no device found Error: unable to open ftdi device with vid 0403, pid 6010, description ‘Dual RS232-HS’, serial ‘’ at bus location '’
However, the error was solved by the following procedure.
・Replace the “Dual RS232-HS” in the following directory with the driver name displayed by zadig(“FT2232H MiniModule”) with grep.(recommend back up directory)
tl;dr:
Could any of you share a working demo project with the ESP32 and FT2232H debugging?
I am especially interested in the platformio.ini and any other edited presets (openOCD should have some too?) and the factory/working EEP/config for the FT2232H since I bought another board, not the original minimodule.
Perfect case: a dump of a working FT_prog.exe .xml config file.